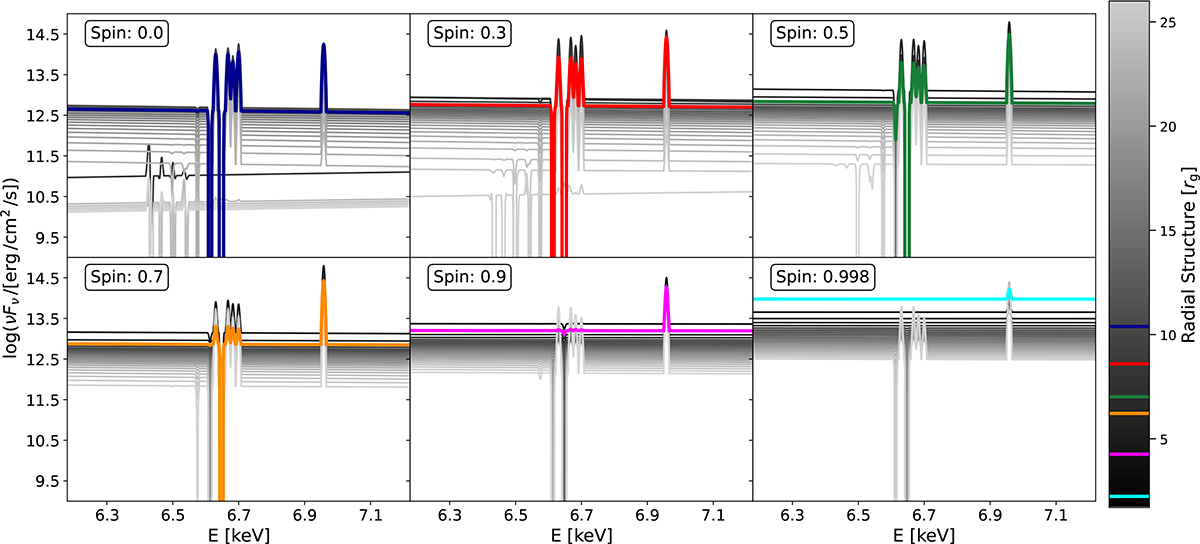
Fig. 5.
Download original image
Local spectra νFν versus photon energy E, from TITAN code, for different spin values at the i = 17.6°. The gray gradient of lines depicts outgoing spectra calculated at different radii, with the darkest line at rin, and the lightest line at rout. The colored lines show the simulation with maximum temperature, which is coherent with the dashed line in Fig. 2 and solid colored lines in Fig. 3. The parameters other than the spin and the viewing angle are set to be canonical values as depicted in Table 2.
Current usage metrics show cumulative count of Article Views (full-text article views including HTML views, PDF and ePub downloads, according to the available data) and Abstracts Views on Vision4Press platform.
Data correspond to usage on the plateform after 2015. The current usage metrics is available 48-96 hours after online publication and is updated daily on week days.
Initial download of the metrics may take a while.