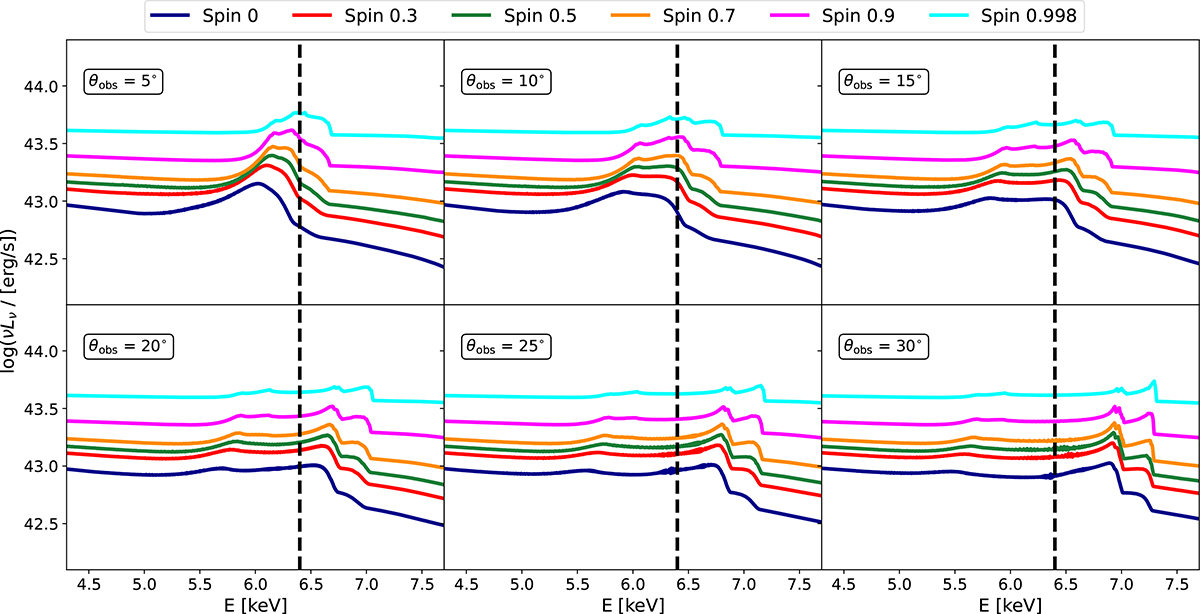
Fig. 8.
Download original image
The reflected ray-traced spectra from TITAN+GYOTO computations, for viewing angles (θobs) of the range from 5° to 30° given in the panel’s boxes. For each θobs, different line colors are plotted according to the spin values, displayed in the box above the figure. All spectra are presented by luminosity νLν versus photon energy E. The vertical dashed line marks the position of 6.4 keV energy.
Current usage metrics show cumulative count of Article Views (full-text article views including HTML views, PDF and ePub downloads, according to the available data) and Abstracts Views on Vision4Press platform.
Data correspond to usage on the plateform after 2015. The current usage metrics is available 48-96 hours after online publication and is updated daily on week days.
Initial download of the metrics may take a while.