Fig. 10
Download original image
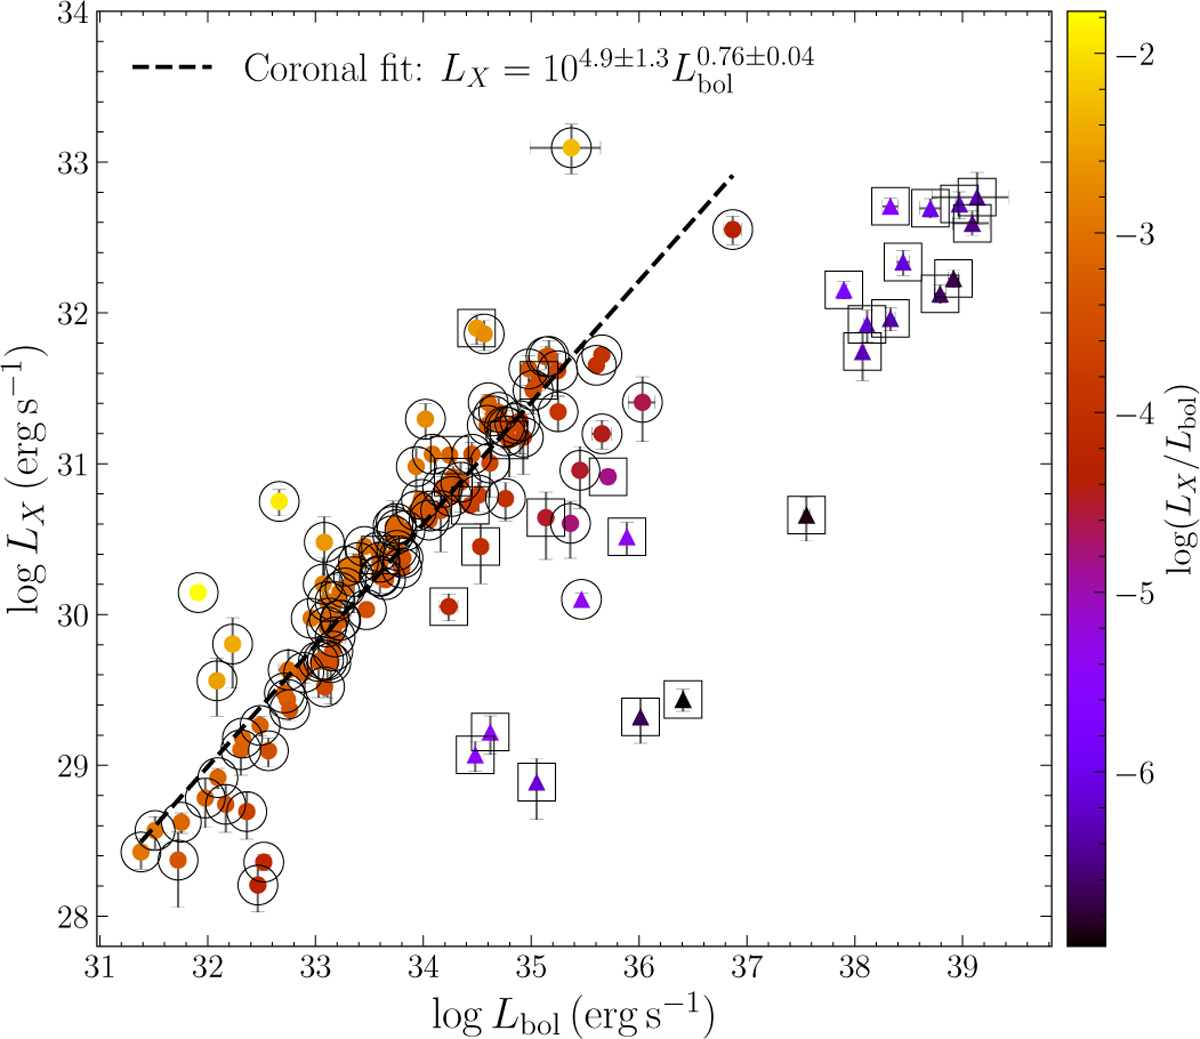
X-ray luminosity, LX, as a function of bolometric luminosity, Lbol, for the eRASS1-detected stars colour coded by the log(LX/Lbol). Circles and triangles indicate sources with log(LX/Lbol) ≥ −5 and log(LX/Lbol) < −5, respectively. In our flux-limited sample, the former group is dominated by coronally active stars, while the latter is consistent with non-coronal (wind-driven) emitters. The dashed line represents the linear fit in log-log space for all the stars (indicated with large open circles), excluding OB-luminous, A-type, F-type and intermediate binaries, which are indicated with open squares.
Current usage metrics show cumulative count of Article Views (full-text article views including HTML views, PDF and ePub downloads, according to the available data) and Abstracts Views on Vision4Press platform.
Data correspond to usage on the plateform after 2015. The current usage metrics is available 48-96 hours after online publication and is updated daily on week days.
Initial download of the metrics may take a while.