Fig. 6
Download original image
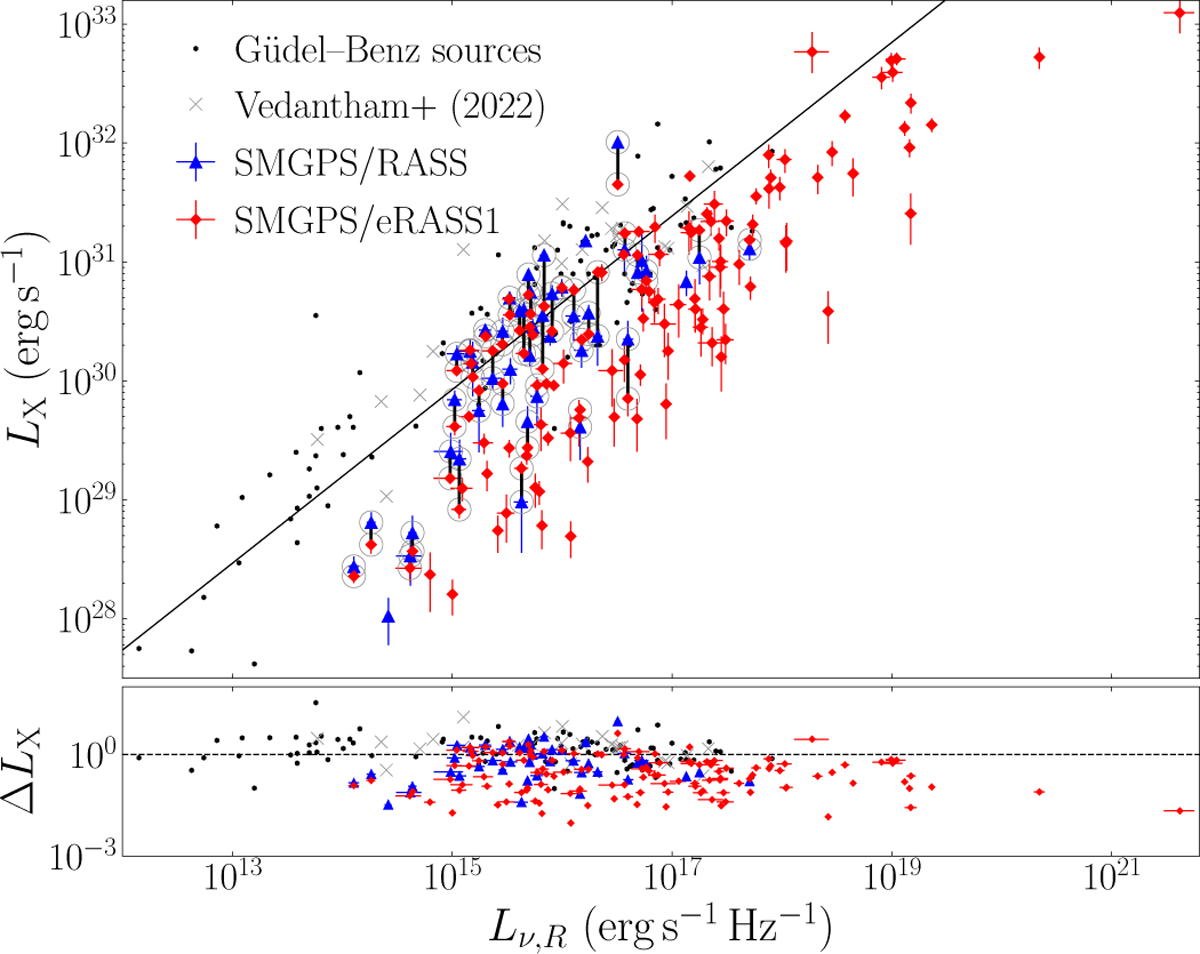
X-ray luminosity as function of specific radio luminosity for SMGPS, RASS, and eRASS1 stars. The triangles and diamonds are detections from RASS and eRASS1, respectively. The black dots and grey crosses are the data from Guedel & Benz (1993); Benz & Guedel (1994) and Vedantham et al. (2022), respectively. The solid line in the top panel of the plot represents the Güdel-Benz fit from Williams et al. (2014). The grey circles and solid vertical lines in the top panel indicate sources detected by both RASS and eRASS1. For each source, the vertical line connects the RASS and eRASS1 measurements, illustrating the level of X-ray variability. The bottom panel shows the residuals of the data from the GBR fit. The error bars in both panels indicate the propagated uncertainties in the measured fluxes and geometric distances for each source.
Current usage metrics show cumulative count of Article Views (full-text article views including HTML views, PDF and ePub downloads, according to the available data) and Abstracts Views on Vision4Press platform.
Data correspond to usage on the plateform after 2015. The current usage metrics is available 48-96 hours after online publication and is updated daily on week days.
Initial download of the metrics may take a while.