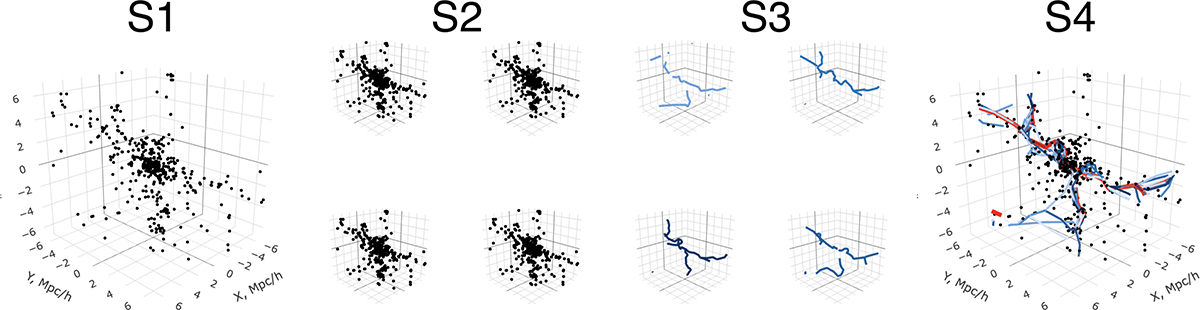
Fig. 1.
Download original image
Four-step method for filament identification at each snapshot. The procedure is illustrated using a zoom-in region with side length 12 Mpc/h, centred on a massive halo with log10(Mhalo/M⊙)[z = 0] = 14.67, at redshift z = 0 in the GAEA2024 model. S1 shows the spatial distribution of all galaxies. S2 presents four random selections, each containing 85% of the galaxy sample. S3 displays the filaments identified by DisPerSE for each corresponding random selection. The final panel, S4, shows all filaments across the four random selections separated by colour. The red lines represent the results of the commonly used approach of running DisPerSE once on all galaxies above the stellar mass threshold for the comparison.
Current usage metrics show cumulative count of Article Views (full-text article views including HTML views, PDF and ePub downloads, according to the available data) and Abstracts Views on Vision4Press platform.
Data correspond to usage on the plateform after 2015. The current usage metrics is available 48-96 hours after online publication and is updated daily on week days.
Initial download of the metrics may take a while.