| Issue |
A&A
Volume 707, March 2026
|
|
|---|---|---|
| Article Number | A377 | |
| Number of page(s) | 20 | |
| Section | Extragalactic astronomy | |
| DOI | https://doi.org/10.1051/0004-6361/202557001 | |
| Published online | 20 March 2026 | |
Environmental history of filament galaxies
Stellar mass assembly and star formation of filament galaxies
1
INAF – Osservatorio Astronomico di Trieste, Via Tiepolo 11, I-34131, Trieste, Italy
2
IFPU – Institute for Fundamental Physics of the Universe, via Beirut 2, 34151, Trieste, Italy
3
INAF – Osservatorio astronomico di Padova, Vicolo dell’Osservatorio, 5, I-35122, Padova, Italy
4
Tianjin Normal University, Binshuixidao 393, 300387, Tianjin, China
⋆ Corresponding author: This email address is being protected from spambots. You need JavaScript enabled to view it.
Received:
27
August
2025
Accepted:
16
February
2026
Abstract
Galaxy properties, such as stellar mass and star formation rate, correlate with their position within the cosmic web. Although galaxy properties can be correlated with a specific environment at a certain cosmic epoch, they may have experienced different environments at previous times. This ‘environmental history’, which is closely linked to pre-processing, is bound to leave an imprint on the observable and physical properties of galaxies. In this work, we use the Galaxy Evolution and Assembly (GAEA) semi-analytic model and the magneto-hydrodynamic IllustrisTNG simulation to reconstruct the environmental histories of galaxies that today reside in filaments between z = 0 and z = 4. Our goal is to understand how galaxy properties are related to their past environments and to uncover the role of the cosmic web in shaping their present-day properties. This approach enables us to determine whether and when filamentary structures influence galaxy evolution. We find that filament galaxies at z = 0 are a heterogeneous mix of populations with distinct environmental histories, and a clear dependency on the infall times into filaments. The vast majority of filament galaxies at z = 0 have experienced group processing at some stage of their evolution, with only ∼20% of galaxies remaining centrals throughout their life. For low-mass filament galaxies (9 < log10(Mstar/Msun)< 10), both GAEA and TNG100 confirm that environmental effects are primarily driven by group processing: Satellite galaxies in this mass range stop growing stellar mass and exhibit elevated quenched fractions, whereas their central counterparts in filaments have properties that are similar to those of field galaxies. In contrast, massive galaxies (log10(Mstar/Msun)> 10) are affected by the filament environment, regardless of being centrals or satellites. Massive galaxies that have never been satellites and that entered filaments more than 9 Gyr ago show accelerated stellar mass assembly and higher quenched fractions relative to the field, due to a higher frequency of merger events inside filaments. Moreover, the most massive log((Mstar/Msun)> 11) galaxies typically accreted onto filaments over 9 Gyr ago and have never become satellites within a larger halo, highlighting the role of filaments in building up the high-mass end of the galaxy population.
Key words: galaxies: evolution / large-scale structure of Universe
© The Authors 2026
 Open Access article, published by EDP Sciences, under the terms of the Creative Commons Attribution License (https://creativecommons.org/licenses/by/4.0), which permits unrestricted use, distribution, and reproduction in any medium, provided the original work is properly cited.
This article is published in open access under the Subscribe to Open model. This email address is being protected from spambots. You need JavaScript enabled to view it. to support open access publication.
1. Introduction
The formation and evolution of galaxies are closely connected to the large-scale structure (LSS) of the Universe. The LSS can be expressed in terms of the spatial distribution of dark matter, gas, and galaxies, which form a web-like network known as the cosmic web (Bond et al. 1996). The presence of such large-scale structures has been prominently revealed by wide-field surveys such as 2dF (Colless et al. 2003) and SDSS (Tegmark et al. 2004). Galaxies form and evolve within this cosmic web, experiencing different large-scale and local environments depending on their location within the LSS. They can reside in dense regions such as gravitationally bound clusters (containing hundreds to thousands of galaxies), or in smaller groups, as well as in elongated structures that connect these systems, known as filaments or walls. In contrast, galaxies located in average or underdense regions are typically referred to as field galaxies. A growing number of both theoretical and observational studies have indicated that galaxy properties exhibit systematic variations as a function of the environment: Galaxies residing in filaments are, on average, more massive and redder than field galaxies, and typically exhibit later morphological types, at least up to z < 0.7 (McNaught-Roberts et al. 2014; Chen et al. 2015; Guo et al. 2015; Chen et al. 2017; Malavasi et al. 2017; Poudel et al. 2017; Bonjean et al. 2020; Laigle et al. 2018; Kraljic et al. 2017; Mahajan et al. 2018; Luber et al. 2019; Kotecha et al. 2022; Hasan et al. 2023; Zakharova et al. 2023; O’Kane et al. 2024).
Environmental effects on structure formation can be broadly divided into two categories: those that enhance halo growth and those that suppress it. On the one hand, filaments, as dense structures, are characterised by an enhanced reservoir of material for accretion compared to the field, leading to the formation of more massive haloes (Lemson & Kauffmann 1999; Mo & White 1996; Wang et al. 2011). On the other hand, the cosmic web exerts a strong tidal field, which can suppress halo accretion and growth (Wang et al. 2011; Musso et al. 2018). Several studies (Hahn et al. 2007; Lee et al. 2017; Borzyszkowski et al. 2017; Musso et al. 2018) have demonstrated that at the low-mass end, tidal fields prevent accretion of new material, while simultaneously allowing massive haloes in dense regions to continue accreting material. The properties of galaxies that reside within these haloes are affected by their assembly histories (Croton et al. 2007; De Lucia et al. 2012), with galaxies gaining, on average, more stellar mass in dense environments (Kraljic et al. 2019).
Moreover, galaxies in filaments may experience more frequent gravitational interactions than in the field (Kuutma et al. 2017), and increased major or minor mergers rates with gas-poor or gas-rich galaxies (Mihos & Hernquist 1996; Hopkins et al. 2008), harassment (Moore et al. 1996), or tidal interactions (Bekki 1998). Finally, the filaments are inhabited by groups or clusters that are characterised by their specific environmental mechanisms, for instance, the interactions between the cold interstellar medium (ISM) of galaxies and the intergalactic medium (IGM) or intra-cluster medium (ICM). Depending on the strength or stage of interaction between ISM and ICM, this process is called ram-pressure stripping (RPS; Gunn et al. 1972), viscous stripping (Nulsen 1982) or thermal evaporation (Cowie & Songaila 1977). The influence of groups and clusters embedded in filaments can dominate the evolution of their member galaxies and leave a characteristic imprint on the overall galaxy population of filaments. This mixing of environmental effects may complicate the identification of the specific role of filaments in shaping galaxy properties, making the separation of group-driven processes a challenging task (Sarron et al. 2019; Zakharova et al. 2024). Furthermore, a few contradictory results on the role of filaments on galaxy properties have been reported. One is that environmental trends within filaments are negligible when controlling for stellar mass, as shown by several studies reporting little to no difference between filament and field galaxies (Alpaslan et al. 2015; Eardley et al. 2015; Perez et al. 2024). The key question is then to what extent the environment governs galaxy properties versus intrinsic factors such as stellar mass (see also De Lucia et al. 2012; Kraljic et al. 2017). Finally, an additional complication is that galaxies do not remain in a single environment throughout their lifetime but can migrate between different environments, making it challenging to identify which stage played the dominant role in shaping their properties.
In this paper, we aim to clarify the role of filaments in galaxy evolution while explicitly accounting for these two factors. Our analysis is based on the IllustrisTNG simulation and the GAlaxy Evolution and Assembly (GAEA) semi-analytic model, which together allow us to trace galaxy evolution across cosmic time within different environments. Specifically, we aim to reconstruct the environmental history of filament galaxies, i.e., the sequence of environments experienced by filament galaxies over cosmic time, and to distinguish between different evolutionary pathways. In both models, we identify galaxies located in filaments that are also part of groups and those that have never resided in such environments. We focus on describing the full environmental history of galaxies with log(Mstar/Msun)> 9 at z = 0 that are located in filaments outside massive clusters log(Mhalo/Msun)> 14. This approach enables us to investigate how key galaxy properties, such as stellar mass and star formation rate (SFR), are influenced by different environmental histories. Moreover, by controlling for stellar mass, we ensure that stellar mass-related processes do not drive the observed trends. Ultimately, this approach enables us to assess when and how galaxies in filaments begin to diverge from their field counterparts.
This paper is organised as follows. Section 2 we describe the details of the models considered: the hydrodynamical IllustrisTNG and the semi-analytical GAEA. Section 3 we explain the identification of galaxy environments at each snapshot and the method for reconstructing the galaxy environmental histories. Section 4 presents the environmental histories of galaxies as predicted by both models, and we discuss the relevant timescales. Section 5 explores how different environmental pathways affect galaxy properties, such as stellar mass and quenched fraction. In Section 6, we interpret the predicted trends, and Section 7 provides a summary of our findings.
2. Theoretical models
We used two different models: the GAEA semi-analytic model (GAEA; De Lucia et al. 2014; Hirschmann et al. 2016; Xie et al. 2020; Fontanot et al. 2021; De Lucia et al. 2024) and the magnetohydrodynamical simulation IllustrisTNG-100 (TNG100; Nelson et al. 2018; Springel et al. 2018; Pillepich et al. 2018a; Naiman et al. 2018; Marinacci et al. 2018). Both models offer a robust framework for understanding galaxy formation and evolution, with comparable simulated volumes and resolutions, as described in detail below.
2.1. The GAEA semi-analytic model
We used predictions from the latest rendition of the GAEA semi-analytic model (De Lucia et al. 2024) coupled with the Millennium II Simulation (MSII; Boylan-Kolchin et al. 2009). GAEA1 is based on the original model presented in De Lucia & Blaizot (2007), but it includes a number of important updates that have been implemented over the years and that are summarised in De Lucia et al. (2024, hereafter, we refer to this model as GAEA2024). GAEA has been tuned to reproduce the following observables: the galaxy stellar mass function up to z ∼ 3, the HI and H2 galaxy mass functions in the local Universe, and the active galactic nuclei (AGN) luminosity function up to z ∼ 4. The used version of the models provides an improved agreement with the observed distributions of specific star-fomation rates (sSFR = SFR/Mstar) in the local Universe, as well as a quite good agreement with the observed passive fractions up to z ∼ 3, making it an ideal tool to interpret the data considered in this work.
The MSII simulation, which represents the backbone of the model used in this study, follows 21603 dark matter particles in a box of 100 Mpc h−1 on a side, with cosmological parameters consistent with WMAP1 (ΩΛ = 0.75, Ωm = 0.25, Ωb = 0.045, n = 1, σ8 = 0.9, and H0 = 73 km s−1 Mpc−1). The resolution of the MSII simulation (the particle mass is 6.9 × 10⁶ Msun h−1) allows galaxies to be well resolved down to stellar masses of ∼108 Msun. Simulation outputs are stored at 68 snapshots, from z = 127 to z = 0. The cosmological parameters adopted for the MSII are not consistent with the latest parameters based on Planck data Planck Collaboration XIII (2016), but the relatively small offsets are not expected to have a significant impact on model predictions (see Fontanot et al. 2025).
2.2. The magnetohydrodynamical simulation IllustrisTNG-100
Additionally, we used predictions from the MHD simulation IllustrisTNG TNG100-1 (hereafter TNG100; Nelson et al. 2018; Springel et al. 2018; Pillepich et al. 2018a; Naiman et al. 2018; Marinacci et al. 2018) corresponding to a comoving volume of 753 h−3 Mpc3 and a baryonic particle mass of mb ∼ 1.4 · 106 Msun. The TNG100 follows the formation and evolution of galaxies throughout cosmic time, including all relevant physical processes, such as galactic winds from stellar feedback (Pillepich et al. 2018b), and a treatment for black hole feedback (Weinberger et al. 2017). The evolution of dark matter, cosmic gas, stars, and supermassive black holes are followed from redshift z = 127 to z = 0, and model results are stored at 100 snapshots. TNG models were calibrated to reproduce observable properties such as the global star formation rate density as a function of time, stellar mass, and stellar-to-halo mass distributions at z = 0 (Pillepich et al. 2018b). The model adopts a ΛCDM cosmology with parameters consistent with Planck Collaboration XIII (2016): ΩΛ = 0.6911, Ωm = 0.3089, Ωb = 0.0486, H0 = 67.74 km s−1 Mpc−1, σ8 = 0.8159, ns = 0.9667.
2.3. Models comparison
The galaxy formation models used in this work, GAEA and IllustrisTNG, differ significantly in their treatment of galaxy evolution and environmental processes. The GAEA2024 model combines dark matter only merger trees with analytic models for the description of baryonic processes, while TNG100 solves hydrodynamical equations for the co-evolution of dark and baryonic matter. Thus, TNG100 should, in principle, include by construction a treatment of all types of interactions between galaxies and the IGM, including gas stripping (such as cosmic web stripping), tidal interactions, harassment, and the effects of large-scale cosmic web tidal fields. GAEA2024 includes an explicit treatment for partitioning the cold gas into its atomic and molecular components and for ram-pressure stripping of both the hot gas and cold gas reservoirs of satellite galaxies (Xie et al. 2017, 2020, see also Xie et al. 2025 for a comparison between GAEA and TNG). It does not include any special treatment for galaxies in filaments (e.g. in terms of tidal fields or gas stripping). Both models account for assembly bias: the assembly of dark matter haloes depends on properties other than halo mass, such as formation time. As demonstrated in earlier work, earlier-formed haloes are more clustered than later-formed haloes of similar mass (Gao et al. 2005), which is bound to have an impact on galaxy properties (Croton et al. 2007; Wang et al. 2013).
3. Method
3.1. Environment identification
To reconstruct the environmental histories of model galaxies in the redshift range 0 < z < 4, we first identify the different environments within the simulated volume at each snapshot for all the most massive progenitors of log(Mstar/M⊙)> 9 galaxies at z = 0. In the following, a group is a system in which a central galaxy hosts at least one satellite at any snapshot above the mass limit considered, while a cluster corresponds to a group with a halo mass of log(Mhalo/Msun)> 14. Filamentary structures are identified in each snapshot. We consider snapshots 29–67 for GAEA2024 and 21–99 for TNG100, corresponding to the redshift range 0 < z < 42. For each model and at each snapshot, filaments are identified employing the cosmic web finder DisPerSE (Sousbie 2011; Sousbie et al. 2011) and adopting the procedure described below.
The galaxy filament system (GFS) is built from the spatial distribution of galaxies. In order to determine the GFS with DisPerSE, we first consider the number of galaxies at each snapshot. Indeed, DisPerSE is sensitive to the number of galaxies used for the filament identification: including more galaxies tends to reveal fainter filamentary structures. To eliminate the “bias” introduced by the increasing galaxy abundance over cosmic time, we adopt a fixed number of galaxies at each snapshot to construct the filaments: approximately 32 000 for GAEA and 19 000 for TNG100. These numbers correspond to the galaxy counts above a stellar mass threshold of log(Mstar/M⊙)> 8 at redshift z = 4. We adopt the lowest possible stellar mass threshold, set by the resolution limits of both models at z = 4, in order to maximise the number of galaxies available for identifying robust filaments at higher redshifts. As shown in Zakharova et al. (2023), selecting galaxies with log(Mstar/Msun)> 9 is sufficient to robustly recover the cosmic web at z ∼ 0, ensuring that our mass cut at low redshifts does not lead to the loss of significant filamentary structures.
Typically, filaments are identified by running DisPerSE once with carefully fine-tuned parameters (e.g., Kraljic et al. 2017; Sarron et al. 2019; Singh et al. 2020). To enhance the robustness of the filament reconstruction, we instead identify the GFS at each snapshot through multiple realisations. Specifically, we perform ten independent DisPerSE runs per snapshot, each based on a randomly selected subset of galaxies. Fig. 1 illustrates a typical region in the GAEA2024 simulated volume containing a massive halo. First, we extract the positions of all galaxies within the selected volume at a given snapshot (panel S1 in Fig. 1), using the stellar mass-selected samples mentioned above. Then, for each realisation, we randomly sample 85% (around 27 000 in GAEA2024 per snapshot, and ∼16 000 in TNG100) of the galaxies (panel S2) and run DisPerSE with fixed parameters to extract the corresponding filament network (panel S3). Filaments are identified using a persistence threshold of 5σ, selecting only the most prominent structures. We do not apply additional smoothing or rejection of short filaments. Instead, we rely on the repeated recovery of filamentary structures across realisations as an indicator of their robustness, avoiding further parameter tuning.
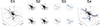 |
Fig. 1. Four-step method for filament identification at each snapshot. The procedure is illustrated using a zoom-in region with side length 12 Mpc/h, centred on a massive halo with log10(Mhalo/M⊙)[z = 0] = 14.67, at redshift z = 0 in the GAEA2024 model. S1 shows the spatial distribution of all galaxies. S2 presents four random selections, each containing 85% of the galaxy sample. S3 displays the filaments identified by DisPerSE for each corresponding random selection. The final panel, S4, shows all filaments across the four random selections separated by colour. The red lines represent the results of the commonly used approach of running DisPerSE once on all galaxies above the stellar mass threshold for the comparison. |
Stacking the ten sub-GFS realisations, we obtain robust filaments for each snapshot, as shown in Panel 4 of Fig. 1. This process involves estimating the distance from each galaxy to each filament realisation. The median of these distances is used to obtain a robust measure of each galaxy’s proximity to the filament. This approach assumes that the ten filament systems converge in the most densely populated regions. The main advantage of our method with respect to the standard approach lies in the mitigation of the effect of ‘flickering’ filaments, for example, the filament at the bottom of each box in the S3 panel that is not always identified. In a single DisPerSE run, flickering filaments disappear in adjacent snapshots. We further reduce the contribution of these features by running the process 10 times independently, thereby increasing the robustness of filament identification. A validation of this method is presented in Appendix A.
We briefly discuss other possibilities for identifying the evolution of filaments through cosmic time. Rather than identifying independent GFSs at each snapshot, we could (i) identify the filaments at each snapshot using the progenitors of z = 0 filament members or (ii) use the descendants of z = 4 filament members at subsequent snapshots.
The first approach would rely on the assumption that the progenitors of galaxies that today reside in filaments were always inside filaments, which may not be the case. Galárraga-Espinosa et al. (2024) showed that the progenitors of present-day massive galaxies do not trace well the cosmic web at high redshifts. More importantly, such a method may allow us to characterise the evolution of filaments but not track the environmental history of galaxies that reside in them.
The second method could provide a robust framework for our analysis. However, it assumes a rigid cosmic web, where new filaments do not form, collapse, or merge. Finally, both methods are limited in comparison to observations, where we lack access to either progenitors or descendants. In observational data, filaments are identified solely based on the spatial distribution of galaxies above a given stellar mass threshold.
Finally, our method provides a consistent evolution of filaments within each simulation. An example is shown in Fig. 2, illustrating the evolution of the filamentary network surrounding the region that forms a cluster log(Mhalo/Msun)≈1014 between z = 0 and z = 4. This figure shows little evolution in filament structure over z ∼ 0 − 1, in agreement with an independent TNG100 analysis that uses galaxies as tracers and reconstructs the filament skeleton from the gravitational potential (Ghafour & Tavasoli 2025).
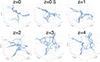 |
Fig. 2. Evolution of the filamentary structure around the region that collapses into a log(Mhalo/Msun)≈1014 cluster at z = 0 in the GAEA2024. Different line colours indicate one of the ten sub-GFSs. |
3.2. Environmental history
Having defined the environment at each snapshot, we now reconstruct the environmental histories of filament galaxies with log(M⋆/M⊙)> 9 at z = 0. When tracing their progenitors back to z = 4, we follow all galaxies with log(M⋆/M⊙)> 7. This ensures that only well-resolved galaxies are included, and that their progenitors can be reliably identified and tracked across cosmic time.
We traced the main progenitors (defined as the most massive stellar progenitor along the galaxy’s merger tree at each earlier snapshot) of each galaxy at z = 0, and evaluated the following parameters at each snapshot:
-
Distance to the filament axis Dfil. Defined as the median 3D distance to the nearest filament in each of the ten sub-GFSs estimated by bootstrapping galaxy positions.
-
Type of the galaxy (central or satellite). GAEA2024 provides this parameter directly as an output. In TNG100, a galaxy is classified as central if its ID matches the halo GroupFirstSub (the ID of the first subhalo of the parent halo, the latter being identified by SubhaloGrNr); otherwise, it is a satellite.
-
Stellar mass. In TNG100, stellar mass is measured considering all star particles gravitationally bound to the subhalo, while in GAEA2024, it is a model-based total stellar mass.
-
Total host halo mass enclosed within Rcrit, 200, defined as the radius within which the average density is 200 times ρcrit. We refer to this halo mass as Mhalo hereafter.
-
Star formation rate. GAEA2024 provides an averaged star formation rate over ∼100 Myr at high redshift and ∼350 Myr at redshift below 0.8, while TNG100 provides only instantaneous star formation rates, that correspond to the star-forming gas cells associated with the considered subhalo. The catalogues published in Donnari et al. (2021a) and Pillepich et al. (2019) contain values averaged over specific time-scales, but only for galaxies with > ∼100 stellar particles. Since we include lower mass progenitors, not all of them have a defined average star formation rate at all snapshots.
Additionally, for each galaxy at z = 0, we estimate the following parameters: (i) τfils – the lookback time when a galaxy first infalls onto a filament and is identified as a filament galaxy in at least the next two snapshots. This infall time is defined as the snapshot where the galaxy approaches a filament at a comoving distance less than the filament radius, Dfil < 1 Mpc/h,3; (ii) τgroup infall – the lookback time when a filament galaxy becomes for the first time a satellite of a group and remains a group member for the two subsequent snapshots. Specifically, for each z = 0 galaxy, we trace its progenitors back to z = 4 and record the first two subsequent snapshots at which it is identified as a satellite (type 1 in GAEA2024 or, in TNG100, the first snapshot at which it resides in a halo of which it is not the central galaxy4). In the following, a group is defined as a system in which a central galaxy hosts at least one satellite. With these selections, the lowest group halo masses at z = 0 in our samples are log(Mhalo/Msun)≃10.7 and ≃10.8 for GAEA2024 and TNG100, respectively, (iii) M70 – the lookback time when a galaxy accumulated 70% of its final stellar mass. Moreover, a galaxy is considered quenched if its specific star formation rate sSFR = SFR/ .
.
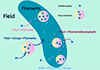 |
Fig. 3. Cartoon representing filament galaxies’ possible environmental history, as explained in Sect. 3.2. |
Using these quantities, we describe the environmental history of z = 0 galaxies that are located in filaments. From now on, we exclude filaments within massive clusters (log10(Mhalo/Msun)> 14) because cluster galaxies experience a strong cluster-specific environment, which is not the focus of this study and would bias our results. The GAEA2024 catalogue contains 5260 galaxies with log10(Mstar/Msun)> 10 (from now on massive galaxies) and 10109 galaxies with 9 < log10(Mstar/Msun)< 10 (from now on low-mass galaxies) in filaments. The corresponding numbers for TNG100 are 2470 and 4610, respectively. Taking into account τfil and τgroup infall, we identified four populations of filament galaxies with different environmental histories as indicated in the cartoon shown in Fig. 3:
-
Field-> Filaments (FF): These are galaxies that fell from the field into the filaments as central galaxies and remain central down to z = 0. This population of central galaxies can span the entire range of halo masses considered. We consider that this population has only experienced the filament environment.
-
Field-> Filaments [backsplash] (FF-B): These are z = 0 central galaxies that fell into filaments from the field, but that at some point in their history became satellites for at least two subsequent snapshots, i.e., backsplash population5.
-
Field-> Filaments-> Group (FFG): These are galaxies that fell from the field into filaments as central galaxies, but then become satellites of a group (≳1012, M⊙) τgroup infall < τfils.
-
Field-> Group-> Filaments (FGF): These are galaxies that fell into filaments as part of a group and stay in a group environment until z = 0 (τgroup infall > τfils ).
Finally, we identified as field galaxies those central galaxies that, at any snapshot, are farther away than 1 Mpc/h from any filament axis and that were never part of a group. This population constitutes our control sample and includes 5534 and 11860 massive and low-mass galaxies in GAEA2024, and 1377 and 4281 galaxies in TNG100.
At this point, we can investigate the role of filaments by directly comparing field galaxies with the FF population, taking into account the time spent within the filaments. The FF-B category will highlight the role of backsplash galaxies, while the FFG or FGF pathways will emphasise the influence of the group environment on galaxy evolution.
4. Environmental history of z = 0 filament galaxies
Figure 4 shows the percentage of filament members that underwent the various environmental histories described in the previous section, for two stellar mass bins. Regardless of the stellar mass and model adopted, the majority of filament galaxies experienced the group environment for some fraction of their lifetime (FGF, FFG and FF-B). Galaxies that are inside filaments and avoided group pre-processing (FF) represent less than 20% of the low-mass galaxy population and 30% of the massive population. This figure highlights the significance of the role that the group environment plays in shaping the observed properties of filament galaxies. Indeed, around 50% of the total filament population first fall into filaments and afterwards infall onto a group (FFG). The fraction of galaxies experiencing this pathway is largest among the low-mass galaxies in GAEA (53.7 ± 0.5%), and lowest among the massive galaxies in TNG100 (45.4 ± 1%). The predominance of the other pathways depends on both the model and the stellar mass. At the massive end, the second most common pathway is FF (about 30% for both models considered). The third most common path for massive galaxies in TNG100 is FF-B with 16.4 ± 0.7%, while GAEA2024 predicts only 7.1 ± 0.4% of galaxies in this environmental history channel. Overall, we find a larger incidence of backsplash galaxies in the hydrodynamical model for massive galaxies. At low masses, in the GAEA2024 model, the second most common path is FGF with 21.5 ± 0.4%, followed by FF-B (14.4 ± 0.3), and FF (10.7 ± 0.3%). The corresponding fractions for TNG100 are: FF with 18.7 ± 0.6%, then FF-B is 14.3 ± 0.5%, and FGF has 19 ± 0.6%. This means that TNG100 predicts a fraction of low-mass galaxies that were never processed as satellites, larger than in GAEA2024.
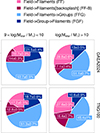 |
Fig. 4. Pie charts showing the fraction of galaxies inside filaments at z = 0 separated by their environmental history and mass for GAEA (top) and TNG100 (bottom). The fraction p and standard error ( |
We investigate how often galaxies outside the filaments6 at z = 0 interacted with groups during their evolution. We stress that, in our definitions, galaxies outside filaments are not equivalent to field galaxies: while field galaxies are always outside filaments and have never been part of a group as satellites, many galaxies outside filaments may have experienced group interactions. We find that a larger fraction of galaxies outside filaments than inside filaments have never interacted with groups: GAEA2024 predicts that 78.9 ± 0.3% (88.4 ± 0.4%) of the low (high)-mass galaxies outside filaments have never been identified as satellites of any group. Considering TNG100, we get that 72.4 ± 0.5 (76.5 ± 1%) of low (high)-mass galaxies never interacted with groups. Comparing these values with those corresponding to galaxies inside filaments, we conclude that it is much more likely for galaxies outside filaments than inside filaments to avoid any interactions with groups. This finding supports the idea that filaments act as bridges connecting groups and clusters (e.g. Tempel et al. 2014), and that there is a higher probability that galaxies within filaments have experienced group environments at some point in their history.
In addition to examining the distribution of filament galaxies across different environmental histories, it is crucial to quantify the timing of when galaxies became filament members, as this allows us to assess when they started to experience the influence of the filament and for how long they have been in such an environment. Figure 5 shows the distribution of τfils for galaxies corresponding to the different environmental paths described above. The two models give consistent overall results. Low-mass FF galaxies, i.e. galaxies that fell directly onto the filaments, are the ones with the youngest τfils values (the peak is around 1.4 Gyr ago for both models). This is also the pathway where low- and high-mass galaxies differ the most: Distributions are skewed towards earlier epochs for more massive galaxies, with the corresponding peak of τfils at ∼11 − 12.5 Gyr in both models. Differences between low- and high-mass galaxies are also clear in the FF-B case, even though they are less pronounced. In both models, low-mass galaxies spent less time in the filaments than their larger mass counterparts. For the two remaining channels, FFG and FGF, no clear differences are evident between the two mass bins. In the FFG case, the infall time distributions for both low-mass and massive galaxies are skewed towards early cosmic epochs with a peak at τfils ∼ 7 − 8 Gyr ago, while the distributions for the FGF case peak around 9 Gyr ago.
 |
Fig. 5. Filament infall times of z = 0 filament members are shown by the distribution of infall times (τfils) separated by environmental history and mass at z = 0 for two models. |
In the FFG and FGF cases, we can measure the time galaxies spend in a filament before falling onto a group, as the difference between τfils and τgroup infall. According to GAEA, low (high)-mass filament galaxies spend on average 1.0 ± 0.1 (1.1 ± 0.2) Gyr before entering the group environment, and 75% of all the galaxies spend less than 3 Gyr in filaments before falling into a group. These numbers rise to 1.7 ± 0.2 (1.2 ± 0.3) Gyr in TNG100, where 75% of the population spend less than 3.5 Gyr in filaments before falling onto a group. If we instead consider the time galaxies spend in groups before infalling into filaments, we find an average duration of 1.5 ± 0.3 Gyr in GAEA and 2.0 ± 0.2 Gyr in TNG100, consistent across both low-mass and massive galaxies, with 75% of the galaxies spending less than 3–4 Gyr as satellites of groups outside filaments in TNG100 (GAEA2024). (In Appendix B, we show, for completeness, the distribution of infall times τgroup infall − τfils for the FGF, FFG, and FF populations.)
We note that the fractions discussed above have a clear dependence on the definition of filaments, and especially on the radius chosen to define filament members. We discuss how results vary when considering different membership criteria for filaments in Appendix C. Overall, regardless of the adopted filament radius, we find that more than half of the filament galaxy population is processed in groups, and the FF population is always a minority. We adopt 1 Mpc/h a typical filament radius Poudel et al. (2017), Kraljic et al. (2017), Kuchner et al. (2020). Using smaller filament radii (e.g., 0.5 Mpc/h) substantially reduces the sample and prevents the analysis presented in this work. Conversely, a larger radius (e.g., 2 Mpc/h) increases the number of galaxies classified as in-filament, but these objects lie farther from the filament spine and are therefore less affected by the filament environment.
5. Dependence of z = 0 filament galaxy properties on their environmental histories
In this section, we investigate how the properties of filament galaxies are shaped by their environmental history. We begin by examining the stellar mass distributions of z = 0 filament members, and tracking their stellar mass assembly over time, to assess whether the two models predict any significant influence of filaments and groups – such as halting or accelerating their stellar mass growth. We then explore the star formation history and gas content of filament galaxies as a function of cosmic time, with a focus on how environmental factors, such as tidal fields or gas accretion through filaments, may modulate star formation.
5.1. Stellar mass at z = 0
We begin by examining the stellar mass of galaxies residing in filaments. Previous studies have established that galaxies located within filaments tend to have higher stellar masses compared to their counterparts in the field (Laigle et al. 2018; Kraljic et al. 2017; Singh et al. 2020). In this section, we investigate if the models considered reproduce these observed trends and to what extent these can be explained by a different environmental history.
Figure 6 shows the cumulative stellar mass distribution of galaxies at z = 0 residing in filaments, separated by their environmental history, alongside the distribution for field galaxies. The figure is complemented by Kolmogorov–Smirnov (KS) test results, which compare the stellar mass distributions of each filament population to those of the field galaxies. Both the KS statistic D, which quantifies the maximum difference between the cumulative distributions, and the corresponding p-value are reported. These tests indicate that massive galaxies exhibit a strong dependence of their z = 0 stellar mass distribution on their environmental history (as reflected by the substantially larger KS statistics), whereas low-mass galaxies show a much smaller dependence. For the low-mass populations in both models, the stellar mass distributions appear very similar to those of the field upon visual inspection, although the KS test still finds a statistically significant albeit small difference between the stellar mass distributions in filaments and in the field..
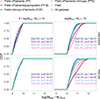 |
Fig. 6. Cumulative mass distribution of the stellar mass of galaxies inside filaments at z = 0 separated by environmental history. The thick grey line shows the corresponding distribution obtained when considering all galaxies in the simulated volume at z = 0. For comparison, the values for the field galaxies are also reported. In each panel, the results of the two-sample KS test comparing filament and field galaxies are reported, including both the KS statistic D and the corresponding p-value. |
The stellar mass distribution of massive galaxies depends significantly on their environmental history, with the FF and FF-B populations in both models showing a clear shift towards higher stellar masses. These two channels include the most massive galaxies, with 16% and 4% (12% and 15.2%) of galaxies exceeding log(Mstar/Msun)=11 in GAEA2024 (TNG100), respectively. The other environmental history channels include fewer than 2.5% of galaxies above this mass threshold. For comparison, field galaxies include only 0.5% and 0.2% of galaxies above the same mass cut. Therefore, both models predict more massive galaxies within filaments than in the field, and a larger fraction of these galaxies were not preprocessed as satellites (i.e., FF or FF-B). Massive filament galaxies that were preprocessed as satellites tend to have lower stellar masses than the FF and FF-B populations, consistent with expectations that group preprocessing quenches star formation and limits stellar mass growth.
Furthermore, the stellar masses of the FF and FF-B populations depend on their infall times onto filaments (see discussion in Appendix D). According to both GAEA2024 and TNG100, massive FF and FF-B galaxies that fell into filaments more than 9 Gyr ago are shifted towards the massive end with respect to other populations of filament galaxies.
5.2. Stellar mass assembly history
We now focus on how galaxies accumulated their stellar mass over time, depending on their environmental history. To minimise biases introduced by differences in stellar mass distributions, we consider mass-matched samples. We consider the evolution of the large-scale structure and filaments, as well as the time spent by galaxies within filaments. We randomly select galaxies at z = 0 from the four environmental history channels considered, divided in bins based on their τfils: τfils < 3 Gyr ago, 3 < τfils < 6 Gyr ago, 6 < τfils < 9 Gyr ago, and τfils > 9 Gyr ago. We also select a control sample of field galaxies. For each of these populations and in any given time bin, we match the stellar mass distribution to that of the field sample. We repeat the random selection 100 times. For each realisation of the stellar mass-matched sample, we compute the median and 1σ confidence interval (via bootstrapping) of the following measured quantities: stellar mass fraction, quenched fraction, and gas content. We then report the overall median as the median across all realisations and define the uncertainty range using the minimum (maximum) of the lower (upper) bounds from the 100 realisations.
Figure 7 presents the stellar mass assembly history for filament galaxies that experienced different environmental pathways. The stellar mass growth is traced by the mass of the main progenitor at each snapshot, normalised by the z = 0 mass: Mstar/Mstar, z = 0. To test the robustness of the observed trends, we repeated the analysis after randomly shuffling the environmental history labels, following an approach similar to that of Kraljic et al. (2017). In this case, the differences between the environmental branches are no longer apparent. This confirms that the results are statistically robust and accurately reflect the impact of environmental history on the assembly of stellar mass in galaxies.
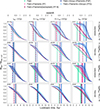 |
Fig. 7. Median cumulative fraction of stellar mass Mstar/Mstar, z = 0 for today’s low-mass (first and second rows) and massive (third and fourth rows) members of filaments categorised by environmental history and infall time into filaments compared to the field galaxies (stellar mass is controlled in each panel). Results are shown for two models with solid lines representing the median and shaded regions indicating uncertainty limits across 100 stellar mass-matched realisations. The vertical lines represent the median time when galaxies build 70% of their mass, with a standard deviation between 100 stellar mass fittings. The number of galaxies in each bin of stellar mass and infall time is given in the top-left corner of each panel. |
The figure shows that the impact of environmental history on stellar mass assembly becomes stronger with earlier infall times onto filaments, for both low-mass and massive galaxies, in both models. Indeed, the stellar mass assembly histories of galaxies that fell onto filaments less than 3 Gyr ago (leftmost column) are close to those of the field galaxies, regardless of the environmental history or stellar mass. In contrast, for galaxies with τfils > 9 Gyr ago (rightmost column) the median stellar mass assembly histories vary significantly across different environmental channels, both for low-mass and high-mass galaxies, in both models. More specifically, galaxies that fell onto filaments less than 3 Gyr ago assembled 70% of the z = 0 stellar mass around 3–4 Gyr ago, largely independent of their environmental histories. For the FF and FFG channels, it is expected that such galaxies spend the majority of their life as field members, and 3 Gyr may be too short a time for filaments to affect the stellar mass assembly. This suggests that the influence of the filament and group environment on stellar mass assembly is not instantaneous and requires a prolonged residence within filaments to become evident.
We now focus exclusively on the rightmost panels of Fig. 7, which show the most prominent trends. For low-mass galaxies (top two rows), distinct stellar mass assembly histories for all populations of filament galaxies compared to field galaxies are evident, most notably for the FGF, FFG, and FF-B populations, that have experienced a group environment. Specifically, low-mass FGF and FFG galaxies assembled their stellar mass earlier, reaching 70% of their present-day mass approximately 6–8 Gyr ago, followed by a clear truncation of stellar growth around 3–5 Gyr ago. In contrast, field galaxies reached 70% of their present mass much later (around 2.4 ± 0.1 Gyr ago in GAEA2024 and 3.5 ± 0.2 Gyr ago in TNG100) and continued to build up their stellar mass down to the present. This earlier assembly and subsequent truncation are seen only in low-mass filament galaxies that were processed as satellites, suggesting that interactions with haloes strongly suppress further stellar mass growth. This is consistent with the well-known efficient quenching of group environments, especially for low-mass galaxies (De Lucia et al. 2012; Xie et al. 2020; Donnari et al. 2021b). Focusing on the FF population, that has never experienced group processing, we find that they continue to build up stellar mass over time, and they assembled 70% of their stellar mass 2.7 ± 0.1 Gyr ago and 4.1 ± 0.1 Gyr for GAEA2024 and TNG100, which is slightly shifted towards earlier assembly compared to the field. We therefore conclude that filaments do not significantly impact the stellar mass assembly for low-mass galaxies, if they have not undergone satellite processing. The absence of any inflection in the growth rate of stellar mass suggests that the tidal field of the cosmic web does not significantly hinder stellar mass growth in low-mass galaxies. Instead, group processing, including that occurring for the backsplash population, appears to be the dominant factor distinguishing galaxies in filaments from their field counterparts.
Moving to massive galaxies (bottom two rows in the rightmost panels of Fig. 8), we find a broadly similar picture: their stellar mass assembly histories differ significantly across different environmental history channels of filament galaxies compared to the field. As for low-mass galaxies, the satellite population of FGF and FFG shows the most pronounced divergence from the field. However, even massive FF galaxies exhibit distinct assembly histories. This trend is particularly pronounced in GAEA2024, that exhibits a substantial shift in stellar mass assembly for the FF population compared to the field. Massive FF galaxies in this model reached 70% of their present-day stellar mass around 5.5 ± 0.2 Gyr ago, and have experienced minimal stellar mass growth over the past 3 Gyr. In contrast, massive field galaxies are still actively assembling their stellar mass, having reached the 70% assembly threshold only around 3.3 ± 0.2 Gyr ago. The TNG100 model also predicts a faster assembly for FF galaxies relative to the field, though the effect is less pronounced and does not show a clear reduction of the stellar mass growth rate at recent cosmic times. In TNG100, FF galaxies reached 70% of their mass by 5.5 ± 0.2 Gyr ago, compared to 4.9 ± 0.1 Gyr ago for field galaxies.
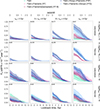 |
Fig. 8. Quenching of the filament populations over time compared to the field population. Quenched fraction of filament population as a function of cosmic time, separated by the environmental history and infall times into filaments (stellar mass is controlled). The galaxy is considered quenched if the sSFR is below 10−11, yr−1. Results are shown for two models, with solid lines representing the median and shaded regions indicating uncertainty limits (16th–84th percentiles) across 100 stellar mass-matched realisations. We note that for the GAEA2024 model, the star formation rate was time averaged, and for TNG100, it was instantaneous. Therefore, comparisons between the models at this stage should be interpreted qualitatively. The number of galaxies in each bin of stellar mass and infall time is given in the top-left corner of each panel. |
5.3. star formation history of filament galaxies
In this section, we discuss how different populations of filament galaxies quench over time, in comparison to the field. Figure 8 shows the evolution of the quenched fraction for galaxies within filaments as a function of cosmic time, for different environmental history channels and infall time onto filaments. As in the previous section, we have matched the stellar mass distributions in each bin of stellar mass and infall time to that of the field galaxies
Again, the difference in quenching fractions between filament and field galaxies, as well as among different filament populations, strongly depends on τfils. In the leftmost panel (corresponding to τfils < 3 Gyr ago), the differences are small or negligible in both models and across both stellar mass bins. However, galaxies that accreted onto filaments earlier exhibit more pronounced differences in their quenching fractions compared to the field. This confirms that environmental history influences the star formation history of galaxies. Again, we discuss the rightmost column since it shows the most pronounced trend.
Focusing on low-mass galaxies, both models predict that the most quenched populations are satellite filament galaxies from the FGF and FFG: 0.74 ± 0.04 (0.65 ± 0.02) and 0.58 ± 0.04 (0.67 ± 0.02) of these galaxies are quenched by z = 0 in GAEA2024 (TNG100), and their quiescent fractions exceed those of field galaxies for at least the last 8 Gyr of evolution. The third most quenched population is FF-B, that also consists of galaxies interacting with haloes as satellites, with Fq = 0.25 − 0.35. In contrast, the FF population of low-mass galaxies exhibits a slightly elevated quiescent fraction compared to the field only in GAEA2024, reaching 0.12 ± 0.02 at z = 0, while the field reaches 0.08 ± 0.03. TNG100 predict no low-mass quenched galaxies in the field, and around 0.01 ± 0.01 for the FF population, so no statistically significant difference. These results suggest that, for low-mass filament galaxies, quenching is primarily driven by group processing, with minimal contribution from the filamentary environment itself, even in TNG100.
For massive galaxies, we also find a distinct Fq evolution over time between field and filament populations. Again, the most quiescent populations are filament satellites from FGF and FFG: 0.76 ± 0.04 or 0.64 ± 0.03 and 0.74 ± 0.05 or 0.58 ± 0.04 up to z = 0, for GAEA2024 and TNG100, respectively. The FF-B and FF populations have quenched fractions of 0.47 ± 0.06 and 0.58 ± 0.05 in GAEA2024, and 0.35 ± 0.03 and 0.28 ± 0.03 in TNG100. In contrast, the field values are relatively lower, 0.33 ± 0.05 or 0.26 ± 0.02. Therefore, all filament populations exhibit a larger fraction of quiescent galaxies, even those that have never been processed as satellites (FF). This effect is especially prominent in GAEA2024 and, similarly to the stellar mass assembly, we attribute it to different assembly histories of galaxies inside filaments and the field. These differences could be driven by higher merger rates in dense environments (Rodriguez-Gomez et al. 2015) or stronger AGN feedback (Weinberger et al. 2018). In TNG100 at z = 0, the differences are not as pronounced as in GAEA2024, but the quenchings pathway of the FF population differs significantly from that of field galaxies at any cosmic time.
We verified that our results are robust against different choices of quenching criteria. In particular, adopting a threshold of more than 1 dex below the star-forming main sequence in the SFR–M⋆ plane yields consistent trends. Additionally, in Appendix F, we check whether the redshift-dependent sSFR cut sSFR < 3/tH affects the results presented here.
6. Discussion
We firstly note that we find no strong evidence that galaxies are significantly affected by the cosmic web tidal field in the TNG100 model: (i) Stellar mass growth in the FF population is not suppressed in either model in any mass bin; (ii) in TNG100, low-mass FF galaxies do not show enhanced quenching relative to the field. While a tidal field impact cannot be fully excluded, its effect appears negligible for the FF population studied here, although it might become relevant for galaxies below our mass threshold (log(Mstar/Msun)< 9).
In the previous Section, we showed that models predict little direct impact of filaments on the stellar mass distribution and quenched fractions for low-mass galaxies. In contrast, group interactions clearly leave a strong imprint: low-mass galaxies in the FGF and FFG populations exhibit larger quenching fractions than filament galaxies that did not experience the group environment. Nevertheless, we still observe a systematic offset in stellar mass assembly histories for FF galaxies compared to the field. This may reflect a higher availability of material for accretion inside the cosmic web, potentially linked to enhanced merger rates or differences in the stellar mass acquired through mergers. Besides, GAEA2024 predict a very prominent difference between the field and the FF population. At the same time, this mode does not implement any filament-specific physical prescription, and therefore, this effect must be driven by differences in merger trees of haloes residing in different environments. We explore the role of mergers in shaping the results of the previous section here.
6.1. Merger history as explanation of different stellar mass assembly
In Sections 5.1 and 5.2, we demonstrated that filaments promote the accumulation of stellar mass in massive galaxies compared to field and group counterparts. Naturally, filament galaxies that are matched to the field population by stellar mass distribution may have already had more massive main progenitors before z = 4, implying that environmental effects could have begun influencing them even before the epoch considered here. However, by z = 0, their stellar masses converge with those of field galaxies – although they follow distinct evolutionary pathways. In particular, we find that the FF population shows a faster stellar mass assembly and a higher fraction of quenched galaxies compared to their field counterparts at fixed stellar mass. We propose three potential explanations for this finding: (1) a higher merger fraction among filament galaxies, (2) larger stellar masses of mergers, and/or (3) higher star formation rates due to an excess of cold gas. In the framework of the models studied, there is no enhancement of star formation within filaments. In fact, we find the opposite: the fraction of quenched galaxies is larger for the FF population. We therefore focus only on the mergers of field and FF galaxies. We examine the merger histories of galaxies as a function of their environmental evolution. Specifically, we extract all progenitors of each galaxy at z = 0 and identify mergers by grouping galaxies with the same descendant. We classify merger events as minor when the stellar mass ratio μ = Mstar, 1/Mstar, 2 lies between 1/10 and 1/4, and as major when μ > 1/4 (only mergers with log(Mstar/Msun)> 7 are considered). For each galaxy and at each snapshot, we count the number of mergers of each type. When more than one merger of a given type occurs at the same snapshot, we compute the corresponding median stellar mass of the minor and major mergers. From now on, we only discuss results for filament galaxies that were accreted onto filaments more than 9 Gyr, as they exhibit the most pronounced differences with respect to field galaxies. In the Appendix E we show, for completeness, the merger rates for all other bins of infall time into filaments.
Figure 9 shows the number of minor and major mergers experienced by one galaxy per 1 Gyr over cosmic time for FF galaxies compared to the field population. As in the previous analysis, we control for stellar mass. For low-mass galaxies, we do not observe an enhanced merger rate (neither major nor minor), compared to the field in either model considered. However, in GAEA2024, the median total stellar mass acquired throught mergers is slightly larger for the FF population (logMstar, total/Msun = 8.0 ± 0.1) than for field galaxies (logMstar, total/Msun = 7.8 ± 0.05). In contrast, TNG100 does not predict a significant difference in the total accreted mass between the FF and field populations, with both around 7.8 ± 0.1. Both models exhibit a smaller scatter in the number of mergers for FF galaxies, suggesting that field galaxies have a broader range of merger histories, whereas FF galaxies follow a more uniform pattern.
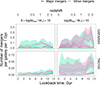 |
Fig. 9. Merger rate for filament members that fell into filaments more than 9 Gyr ago. The lines represent the median number of major (solid line) and minor (dotted line) mergers per galaxy per 1 Gyr as a function of cosmic time, categorised by environmental history when stellar mass is controlled. The values represent the total number of major mergers, normalised by the total number of galaxies considered. The figure shows the median across realisations with the 16th–84th percentile interval. |
For the massive FF population, we find the same minor merger rate in both models, with scatter between realisations, but GAEA2024 also predicts an elevated major merger rate. The higher major merger rate measured for the FF population explains the significant difference in stellar mass assembly history between the FF and field populations in GAEA2024 (see Figure 7). The absence of such an enhancement in TNG100 is consistent with the smaller difference in stellar mass assembly found between the two populations for this model. Moreover, the total stellar mass of merged galaxies in GAEA2024 of FF population reaches logMstar, total/Msun = 9.2 ± 0.2 which is larger than that found for the field (logMstar, total/Msun = 8.6 ± 0.1). In TNG100, we do not find a significant difference, and the total stellar mass of FF and field mergers is comparable logMstar, total/Msun = 8.6 ± 0.2.
In conclusion, variations in major or minor merger rates cannot account for the stellar mass assembly differences of low-mass filament galaxies, as both models predict only minor variations across populations. For the FF population, GAEA2024 attributes the difference to more massive mergers, while TNG100 does not. Overall, however, the differences for low-mass galaxies, and in TNG100 in particular, remain small.
For massive galaxies, the two models diverge. In GAEA2024, FF galaxies show a markedly different stellar mass assembly from the field (Figure 7), driven by higher rates of both major and minor mergers with more massive companions. In TNG100, merger rates are similar across populations, but the mergers involve more massive galaxies, producing a divergence in stellar mass assembly. These results suggest that galaxies accreted onto filaments earlier tend to merge with more massive neighbours, allowing them to build up larger stellar masses.
Overall, Appendix E shows that the observed trend is weaker for galaxies that were accreted onto filaments in the last 9 Gyr, consistent with the smaller differences in stellar mass assembly reported earlier.
We note that, in TNG100, the differences in stellar mass assembly largely disappear when controlling for stellar mass. However, this does not mean that filaments are irrelevant to the evolution of galaxies in this model. The most massive galaxies are still found exclusively within filaments and only when group processing is absent. These galaxies are typically central group members that grow through the accretion of satellites, which are more numerous in groups embedded in filaments (Guo et al. 2015). A similar but even stronger trend is found in GAEA2024.
Finally, we note that Dulcien et al. (2025, in prep.) discuss observational evidence for an enhanced galaxy merger rate in filaments, based on elevated galaxy-pair counts in cluster-connected filaments in the 4MOST CHANCES survey relative to both field and cluster environments, supporting our findings.
6.2. Excess of quenched galaxies in FF population
In Sec. 5.3, we demonstrated an excess of quenched galaxies inside filaments. At z = 0, massive galaxies that were accreted onto filaments more than 9 Gyr ago exhibit a higher quenched fraction than field galaxies in both models. This result is expected for galaxies that have interacted with groups as satellites, as groups are known to host a higher fraction of quenched populations (Wetzel et al. 2012; Donnari et al. 2021b). However, our findings also reveal that this trend extends to the FF population, which has never interacted with haloes as satellites and thus has not experienced the environmental influence of groups. In this section, we discuss these findings in more detail, with a special focus on the role of filaments.
To better understand the nature of galaxy quenching inside filaments, we estimate the quenching timescales. Our approach is primarily based on the approach used in Walters et al. (2022). In brief, we analysed the evolution of the specific star formation rate (sSFR) over time for the main progenitor of each galaxy identified at z = 0. First, for each model, we determined how the sSFR evolves with lookback time for all star-forming galaxies at z = 0, assuming they remained star-forming throughout their history. This establishes a reference “main sequence” of sSFR evolution for galaxies that have not experienced quenching. Quenching is then defined as a deviation below this sequence. We then identified the quenching starting time (tstart) as the point when a galaxy sSFR first falls below the 1σ lower bound of the main sequence. A quenching time (tquench) is defined as the moment when the galaxy sSFR drops below 10−11 yr−1. The quenching timescale is then given by the time difference between tstart and tquench. Based on this timescale, galaxies are classified as: fast-quenching (≤1 Gyr), slow-quenching (> 1 Gyr), or rejuvenated (if their sSFR increases above the 10−11 yr−1 again after quenching, and this lasts for at least two subsequent snapshots).
The results of this classification for massive FF galaxies at z = 0 and entering filaments more than 9 Gyr ago are shown in Fig. 10 alongside field galaxies of the same stellar mass.
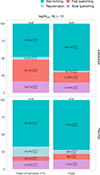 |
Fig. 10. Distribution of the fraction of galaxy types by star formation or quenching status presented for galaxies within filaments (FF) and fields at z = 0, with stellar mass controlled. Only massive galaxies that fell into filaments more than 9 Gyr ago are included. Populations are categorised into star-forming, rejuvenated, fast-quenched, and slow-quenched based on the evolution of their sSFR. |
In GAEA2024, around 70% of the field galaxies remain star-forming at z = 0, while the quiescent population is almost evenly split between fast- and slow-quenching galaxies, each comprising approximately 15%. For the FF population of massive galaxies, only 50% remain star-forming at z = 0, while the fractions of slow-quenching and rejuvenated cases are comparable to those in the field. Therefore, the excess of quenched galaxies in the FF population must be driven by fast quenching processes. Out of the 32% of fast-quenched FF galaxies, about half (i.e., 16-17%) could be attributed to processes similar to those responsible for fast quenching in the field population. This implies that the remaining 15% must be linked to environmental mechanisms specific to the FF population. Since GAEA2024 does not include stripping mechanisms within filaments, the most plausible fast quenching channels are AGN feedback and merger events. To test this, we examine whether merger events occur in GAEA2024 within 1 Gyr before the fast quenching episode. We find a notable difference between the FF and field populations: 56 per cent of fast-quenched FF galaxies can be linked to mergers, whereas only 35 per cent of fast-quenched field galaxies have experienced mergers at the time of quenching (this value should be considered as an upper limit). We also note that GAEA2024 predicts a negligible impact of rejuvenation, with similar rates between the field and FF populations
The TNG100 model predicts that massive FF galaxies and field galaxies have the same fraction (around 70%) of star-forming systems at z = 0. Moreover, the fractions of fast- and slowly quenched massive galaxies are consistent within uncertainties between the FF and field populations. The only notable difference between the two environments is that TNG100 predicts a significantly higher fraction of rejuvenated galaxies inside filaments compared to the field. This implies that TNG100 primarily associates filaments with multiple episodes of quenching and rejuvenation, without specifically enhancing the fractions of fast or slow quenching. This highlights important differences between the models: TNG100 predicts more frequent rejuvenation events in filaments compared to GAEA2024, along with a lower fraction of rapidly quenched galaxies in these environments.
Lastly, in Appendix F, we check that the results in this section are not affected by the selection of quenched galaxies as all galaxies below sSFR < 10−11 yr−1 when switching to redshift dependent cut sSFR < 3/tH.
7. Conclusions
In this paper, we reconstruct the environmental history of filament galaxies at z = 0 to better understand the role of environment (specifically filaments and the groups embedded within them) in galaxy evolution. We introduce new metrics, such as the infall time into filaments and groups and their environmental histories, that have not been considered in previous studies. Our approach enables us to isolate the impact of different evolutionary pathways of filament galaxies on their present-day properties by comparing the Field-> Filaments population with a control sample of field and group populations within filaments. Our main results can be summarised as follows:
-
Filaments host a heterogeneous population of galaxies with diverse environmental histories and infall times. GAEA2024 and TNG100 yield consistent environmental histories, with most galaxies within filaments having spent part of their evolution as satellites (FFG, FGF and FF-B populations).
-
About 50% of the filament population experienced the Field-> Filaments-> Group path, and they typically live in a filament environment for 1–3 Gyr before falling onto the current parent group.
-
Only 10–20% of low-mass galaxies and 30% of massive galaxies have never been satellites (FF population) and were influenced solely by the filamentary environment.
-
Low-mass galaxies (9 < log10(Mstar/Msun)< 10) in filaments are primarily regulated by group processing, with direct filament effects being minimal.
-
Massive central galaxies (log10(Mstar/Msun)> 10) in filaments experience enhanced mass growth with respect to the field. Galaxies with log10(Mstar/Msun)> 11 typically entered the filaments more than 9 Gyr ago and remained centrals until present. In this galaxy mass range, filaments enable faster growth than in the field via a larger rate of mergers, and systematically more massive mergers (particularly in GAEA2024). The FF population exhibits larger quenched fractions than the field in both models, which is evidence of filament-driven quenching associated with merger activity (most pronounced in GAEA2024).
-
The impact of the environment on galaxy properties, such as stellar mass or quenched fraction, becomes increasingly significant with time, as they fall into filaments and groups. This is consistent with the broader pre-processing paradigm, in which group and filament environments can suppress star formation (Fujita 2004).
Taken together, our results demonstrate that filaments are not simply transitional pathways to groups and clusters, but environments that directly influence galaxy evolution, although their impact is not dramatic. The mixing of galaxies with different environmental histories and infall times makes it challenging to isolate the specific role of filaments in observational data. The role of environment is mass-dependent: for low-mass galaxies, groups remain the dominant regulatory environment, whereas for massive galaxies, filaments foster accelerated growth, enhanced merger activity, and elevated quenching. As expected, the impact on galaxy properties is stronger for galaxies that have resided in the filament environment for longer times, highlighting the need to incorporate full environmental histories for a correct interpretation of the environmental trends.
Acknowledgments
We thank the anonymous referee for thoughtful and constructive comments that significantly improved the clarity and robustness of our analysis and the presentation of our results.
References
- Alpaslan, M., Driver, S., Robotham, A. S. G., et al. 2015, MNRAS, 451, 3249 [Google Scholar]
- Bekki, K. 1998, ApJ, 502, L133 [NASA ADS] [CrossRef] [Google Scholar]
- Bond, J. R., Kofman, L., & Pogosyan, D. 1996, Nature, 380, 603 [NASA ADS] [CrossRef] [Google Scholar]
- Bonjean, V., Aghanim, N., Douspis, M., Malavasi, N., & Tanimura, H. 2020, A&A, 638, A75 [NASA ADS] [CrossRef] [EDP Sciences] [Google Scholar]
- Borzyszkowski, M., Porciani, C., Romano-Díaz, E., & Garaldi, E. 2017, MNRAS, 469, 594 [NASA ADS] [CrossRef] [Google Scholar]
- Boylan-Kolchin, M., Springel, V., White, S. D. M., Jenkins, A., & Lemson, G. 2009, MNRAS, 398, 1150 [Google Scholar]
- Chen, Y.-C., Ho, S., Freeman, P. E., Genovese, C. R., & Wasserman, L. 2015, MNRAS, 454, 1140 [CrossRef] [Google Scholar]
- Chen, Y.-C., Ho, S., Mandelbaum, R., et al. 2017, MNRAS, 466, 1880 [NASA ADS] [CrossRef] [Google Scholar]
- Colless, M., Peterson, B. A., Jackson, C., et al. 2003, arXiv e-prints [arXiv:astro-ph/0306581] [Google Scholar]
- Cowie, L. L., & Songaila, A. 1977, Nature, 266, 501 [Google Scholar]
- Croton, D. J., Gao, L., & White, S. D. M. 2007, MNRAS, 374, 1303 [Google Scholar]
- De Lucia, G., & Blaizot, J. 2007, MNRAS, 375, 2 [Google Scholar]
- De Lucia, G., Weinmann, S., Poggianti, B. M., Aragón-Salamanca, A., & Zaritsky, D. 2012, MNRAS, 423, 1277 [NASA ADS] [CrossRef] [Google Scholar]
- De Lucia, G., Tornatore, L., Frenk, C. S., et al. 2014, MNRAS, 445, 970 [Google Scholar]
- De Lucia, G., Fontanot, F., Xie, L., & Hirschmann, M. 2024, A&A, 687, A68 [NASA ADS] [CrossRef] [EDP Sciences] [Google Scholar]
- Donnari, M., Pillepich, A., Joshi, G. D., et al. 2021a, MNRAS, 500, 4004 [Google Scholar]
- Donnari, M., Pillepich, A., Nelson, D., et al. 2021b, MNRAS, 506, 4760 [NASA ADS] [CrossRef] [Google Scholar]
- Eardley, E., Peacock, J. A., McNaught-Roberts, T., et al. 2015, MNRAS, 448, 3665 [NASA ADS] [CrossRef] [Google Scholar]
- Fontanot, F., Calabrò, A., Talia, M., et al. 2021, MNRAS, 504, 4481 [CrossRef] [Google Scholar]
- Fontanot, F., De Lucia, G., Xie, L., et al. 2025, A&A, 699, A108 [NASA ADS] [CrossRef] [EDP Sciences] [Google Scholar]
- Fujita, Y. 2004, PASJ, 56, 29 [NASA ADS] [Google Scholar]
- Galárraga-Espinosa, D., Cadiou, C., Gouin, C., et al. 2024, A&A, 684, A63 [NASA ADS] [CrossRef] [EDP Sciences] [Google Scholar]
- Gao, L., Springel, V., & White, S. D. M. 2005, MNRAS, 363, L66 [NASA ADS] [CrossRef] [Google Scholar]
- Ghafour, P., & Tavasoli, S. 2025, ApJ, 990, 119 [Google Scholar]
- Gunn, J. E., Gott, J., & Richard, I. 1972, ApJ, 176, 1 [Google Scholar]
- Guo, Q., Tempel, E., & Libeskind, N. I. 2015, ApJ, 800, 112 [Google Scholar]
- Hahn, O., Carollo, C. M., Porciani, C., & Dekel, A. 2007, MNRAS, 381, 41 [NASA ADS] [CrossRef] [Google Scholar]
- Hasan, F., Burchett, J. N., Abeyta, A., et al. 2023, ApJ, 950, 114 [NASA ADS] [CrossRef] [Google Scholar]
- Hirschmann, M., De Lucia, G., & Fontanot, F. 2016, MNRAS, 461, 1760 [Google Scholar]
- Hopkins, P. F., Hernquist, L., Cox, T. J., Younger, J. D., & Besla, G. 2008, ApJ, 688, 757 [Google Scholar]
- Kotecha, S., Welker, C., Zhou, Z., et al. 2022, MNRAS, 512, 926 [NASA ADS] [CrossRef] [Google Scholar]
- Kraljic, K., Arnouts, S., Pichon, C., et al. 2017, MNRAS, 474, 547 [Google Scholar]
- Kraljic, K., Pichon, C., Dubois, Y., et al. 2019, MNRAS, 483, 3227 [Google Scholar]
- Kuchner, U., Aragón-Salamanca, A., Pearce, F. R., et al. 2020, MNRAS, 494, 5473 [NASA ADS] [CrossRef] [Google Scholar]
- Kuutma, T., Tamm, A., & Tempel, E. 2017, A&A, 600, L6 [NASA ADS] [CrossRef] [EDP Sciences] [Google Scholar]
- Laigle, C., Pichon, C., Arnouts, S., et al. 2018, MNRAS, 474, 5437 [Google Scholar]
- Lee, C. T., Primack, J. R., Behroozi, P., et al. 2017, MNRAS, 466, 3834 [CrossRef] [Google Scholar]
- Lemson, G., & Kauffmann, G. 1999, MNRAS, 302, 111 [NASA ADS] [CrossRef] [Google Scholar]
- Luber, N., van Gorkom, J. H., Hess, K. M., et al. 2019, AJ, 157, 254 [NASA ADS] [CrossRef] [Google Scholar]
- Mahajan, S., Singh, A., & Shobhana, D. 2018, MNRAS, 478, 4336 [NASA ADS] [Google Scholar]
- Malavasi, N., Arnouts, S., Vibert, D., et al. 2017, MNRAS, 465, 3817 [Google Scholar]
- Marinacci, F., Vogelsberger, M., Pakmor, R., et al. 2018, MNRAS, 480, 5113 [NASA ADS] [Google Scholar]
- McNaught-Roberts, T., Norberg, P., Baugh, C., et al. 2014, MNRAS, 445, 2125 [Google Scholar]
- Mihos, J. C., & Hernquist, L. 1996, ApJ, 464, 641 [Google Scholar]
- Mo, H. J., & White, S. D. M. 1996, MNRAS, 282, 347 [Google Scholar]
- Moore, B., Katz, N., Lake, G., Dressler, A., & Oemler, A. 1996, Nature, 379, 613 [Google Scholar]
- Musso, M., Cadiou, C., Pichon, C., et al. 2018, MNRAS, 476, 4877 [Google Scholar]
- Naiman, J. P., Pillepich, A., Springel, V., et al. 2018, MNRAS, 477, 1206 [Google Scholar]
- Nelson, D., Pillepich, A., Springel, V., et al. 2018, MNRAS, 475, 624 [Google Scholar]
- Nulsen, P. E. J. 1982, MNRAS, 198, 1007 [Google Scholar]
- O’Kane, C. J., Kuchner, U., Gray, M. E., & Aragón-Salamanca, A. 2024, MNRAS, 534, 1682 [CrossRef] [Google Scholar]
- Perez, N. R., Pereyra, L. A., Coldwell, G., et al. 2024, MNRAS, [arXiv:2405.01671] [Google Scholar]
- Pillepich, A., Nelson, D., Hernquist, L., et al. 2018a, MNRAS, 475, 648 [Google Scholar]
- Pillepich, A., Springel, V., Nelson, D., et al. 2018b, MNRAS, 473, 4077 [Google Scholar]
- Pillepich, A., Nelson, D., Springel, V., et al. 2019, MNRAS, 490, 3196 [Google Scholar]
- Planck Collaboration XIII. 2016, A&A, 594, A13 [NASA ADS] [CrossRef] [EDP Sciences] [Google Scholar]
- Poudel, A., Heinämäki, P., Tempel, E., et al. 2017, A&A, 597, A86 [NASA ADS] [CrossRef] [EDP Sciences] [Google Scholar]
- Rodriguez-Gomez, V., Genel, S., Vogelsberger, M., et al. 2015, MNRAS, 449, 49 [Google Scholar]
- Sarron, F., Adami, C., Durret, F., & Laigle, C. 2019, A&A, 632, A49 [NASA ADS] [CrossRef] [EDP Sciences] [Google Scholar]
- Singh, A., Mahajan, S., & Bagla, J. S. 2020, MNRAS, 497, 2265 [Google Scholar]
- Sousbie, T. 2011, MNRAS, 414, 350 [NASA ADS] [CrossRef] [Google Scholar]
- Sousbie, T., Pichon, C., & Kawahara, H. 2011, MNRAS, 414, 384 [NASA ADS] [CrossRef] [Google Scholar]
- Springel, V., Pakmor, R., Pillepich, A., et al. 2018, MNRAS, 475, 676 [Google Scholar]
- Tegmark, M., Blanton, M. R., Strauss, M. A., et al. 2004, ApJ, 606, 702 [Google Scholar]
- Tempel, E., Kipper, R., Saar, E., et al. 2014, A&A, 572, A8 [NASA ADS] [CrossRef] [EDP Sciences] [Google Scholar]
- Walters, D., Woo, J., & Ellison, S. L. 2022, MNRAS, 511, 6126 [NASA ADS] [CrossRef] [Google Scholar]
- Wang, H., Mo, H. J., Jing, Y. P., Yang, X., & Wang, Y. 2011, MNRAS, 413, 1973 [NASA ADS] [CrossRef] [Google Scholar]
- Wang, L., Weinmann, S. M., De Lucia, G., & Yang, X. 2013, MNRAS, 433, 515 [NASA ADS] [CrossRef] [Google Scholar]
- Weinberger, R., Springel, V., Hernquist, L., et al. 2017, MNRAS, 465, 3291 [Google Scholar]
- Weinberger, R., Springel, V., Pakmor, R., et al. 2018, MNRAS, 479, 4056 [Google Scholar]
- Wetzel, A. R., Tinker, J. L., & Conroy, C. 2012, MNRAS, 424, 232 [NASA ADS] [CrossRef] [Google Scholar]
- Xie, L., De Lucia, G., Hirschmann, M., Fontanot, F., & Zoldan, A. 2017, MNRAS, 469, 968 [Google Scholar]
- Xie, L., De Lucia, G., Hirschmann, M., & Fontanot, F. 2020, MNRAS, 498, 4327 [NASA ADS] [CrossRef] [Google Scholar]
- Xie, L., De Lucia, G., Fossati, M., Fontanot, F., & Hirschmann, M. 2025, A&A, 698, A73 [NASA ADS] [CrossRef] [EDP Sciences] [Google Scholar]
- Zakharova, D., Vulcani, B., De Lucia, G., et al. 2023, MNRAS, 525, 4079 [NASA ADS] [CrossRef] [Google Scholar]
- Zakharova, D., Vulcani, B., De Lucia, G., et al. 2024, A&A, 690, A300 [NASA ADS] [CrossRef] [EDP Sciences] [Google Scholar]
Information about the GAEA model and selected model predictions can be found at https://sites.google.com/inaf.it/gaea.
The upper redshift limit is set to z = 4 because the time intervals between snapshots in the Millennium Simulation II become too large at earlier times, limiting temporal resolution. The snapshot definition differs between the two models: GAEA (67 snapshots in total) has coarser time sampling, with redshift intervals of δz ∼ 0.3 around z ≈ 4, while TNG100 (100 snapshots) provides finer sampling of δz ∼ 0.1 − 0.2 around the same range.
We neglected cases of filament backsplashes, even if they occur.
Orphan galaxies are excluded from the analysis.
We did not test if there is a difference between galaxies that interact with haloes as satellites before or after their infall onto a filament.
These galaxies do not enter the statistics shown in Fig. 4.
Appendix A: Validation of the adopted filament extraction procedure
To identify filaments, we select a subsample (85 per cent) of the tracer galaxies and employ the DisPerSE algorithm as described in the main text. We repeat the procedure ten times per snapshot considered and, for each galaxy, measure its distance to the filaments in each realisation (ten distances per galaxy). We validate this method using the quartile coefficient of dispersion (QCD), defined as (QCD = (Q75 − Q25)/(Q75 + Q25)). Lower QCD values reflect a tighter interquartile spread around a stable value, more reliable distance measurements. We compute this quantity for the snapshots at z = 0, z = 1, z = 2 and z = 4 from the TNG100 model and show the results in Fig. A.1. The vertical lines mark the median values at each redshift: QCDz=4 = 0.37, QCDz=2 = 0.3−,QCDz=1 = 0.22, and QCDz=0 = 0.16. At all redshifts, the distributions peak near ≈0.05, indicating good convergence of the filament identification realisations and the associated galaxy–to–filament distances. At higher redshifts, the distributions exhibit more prominent tails towards larger values, with the median consistently shifting upwards. This trend indicates reduced convergence a reduced convergence across realisations at higher redshifts, is consistent with expectations: at earlier cosmic epochs, the filament contrast sampled by galaxies is lower (and the sampling sparser), which makes the reconstruction less stable from one realisation to another.
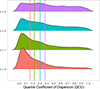 |
Fig. A.1. Distributions of the per-galaxy quartile coefficient of dispersion (QCD = (Q75 − Q25)/(Q75 + Q25) ), computed from ten independent distance-to-filament estimates for each galaxy, at z = 0, z = 1, z = 2, and z = 4. Vertical lines mark the bootstrap median QCD for each redshift; lower values indicate better convergence. |
Appendix B: τgroup infall distribution for FGF, FFG, and FF-B populations
Fig. B.1 shows the distributions of the time difference between group infall and filament infall, τgroup, infall − τfils, for the FGF, FFG, and FF-B populations in both models. We find good agreement between the two models, supporting the absence of significant differences between semi-analytical and hydrodynamical approaches in tracing the environmental histories of galaxies. For the FFG population, the distributions are broad and span a wide range of positive values, with the majority of galaxies becoming associated with filaments within 0–3 Gyr after infall into a group. The FGF population is characterised by distributions also skewed towards zero, indicating that galaxies infalling into filaments typically enter their host group rapidly, within ∼3 Gyr. Finally, the FF-B population exhibits a broader spread in both models, suggesting that backsplash events occur both inside and outside filaments.
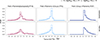 |
Fig. B.1. Difference between the infall time into groups, τgroup infall, and the infall time onto filaments,τfils, for the filament populations (FGF, FFG, and FF-B). |
Appendix C: Environmental history variation with adopted filament radii
The reported contribution of different environmental histories of galaxies inside filaments depends on the adopted filament radii. In the main analysis, we select all galaxies within 1 Mpc/h of the filament axis, but here we explore alternative choices of 0.5 and 2 Mpc/h. Figures C.1 and C.2 show the fractions of filament members using radii of 0.5 and 2 Mpc/h, respectively. Overall, regardless of the adopted radii, more than half of the population of filament members are galaxies inside groups. When a radius of 0.5 Mpc/h is used, this fraction is even higher – reaching around 90–95% for low-mass and 65–75% for massive population. This is because galaxy groups within filaments typically lie closer to the filament axis, or because filament-finding algorithms tend to trace the axis through group regions. For the same reason, the fraction of the FF population increases if we consider larger filament radii. We repeated all tests presented in the main body of the paper using a filament radius of 2 Mpc/h. Our results remain qualitatively the same but become weaker, which is consistent with the inclusion of galaxies at larger distances from the filament spine, where galaxies are less affected by the specific filament environment. We did not perform the same test with 0.5 Mpc/h due to low number statistics.
Appendix D: Stellar mass at z=0 of filament galaxies as a function of infall time
Figure D.1 shows the CDF of stellar mass at z=0 for filament galaxies that underwent different environmental histories. The most striking feature is that FF galaxies accreted onto filaments less than 3 Gyr ago have a median stellar mass of  (10.4 ± 0.3), while those accreted more than 9 Gyr ago have median masses of
  (11.0 ± 0.4). No such dependence on infall time is found for low-mass galaxies or other environmental history channels for massive galaxies. This suggests that the filaments favour mass growth (if galaxies are not satellites), and the shift towards more massive filaments galaxies reported in previous works is due to FF and FF-B populations.
Appendix E: Full merger history of FF and field galaxies
Here, we demonstrate, for completeness, the merger rates for the FF and field populations for infall times less than 9 Gyr, while the case of more than 9 Gyr were discussed in Sec. 6. Fig. E.1 shows all merger rates for the FF and field populations for each of the four τfils bins. According to both models, low-mass galaxy merger rates, both major and minor, are similar within the uncertainties between the FF and field populations, regardless of the infall time into filaments. For massive galaxies, TNG100 also predicts the same merger rates regardless of infall time into filaments. In contrast, the GAEA2024 model predicts that only galaxies that fell early into filaments (> 9 Gyr ago) demonstrate a higher major merger rate compared to the field population when stellar mass is controlled. Moreover, this trend can also be observed in galaxies that infall into filaments between 6 and 9 Gyr ago, although it is weaker. For earlier infall bins, the trend weakens further and becomes undetectable. This reveals the importance of early infall into filaments in uncovering the distinct properties of filaments, according to GAEA2024.
Appendix F: Impact of the quenched galaxy definition
We selected quenched galaxies using a redshift-independent sSFR cut: sSFR = SFR / Mstar < 10−11 yr−1. This approach does not take into account the evolution of the star formation–stellar mass relation and may lead to an underestimation of the quenched fraction of galaxies at high redshifts. Here, we test the impact of alternative selections. Specifically, we define a quenching galaxy as sSFR < 3/tH to account for the redshift dependency on the quenching fraction.
Fig. F.1 shows the analogue of Fig. 8, obtained using this alternative definition of the quenched fraction. We find that all trends identified in the original analysis are recovered, and that our conclusions remain valid. The largest differences between the two definitions are observed for galaxies in the group populations (FFG and FGF), where a fixed sSFR threshold leads to an underestimation of the quenched fraction at high redshifts and to an overestimation at z = 0. In contrast, Field, FF, and FF-B galaxies exhibit almost no quenched population at z > 2, with differences between the two definitions emerging primarily at z = 0, where the fixed sSFR criterion again results in larger quenched fractions compared to the alternative definition.
Fig. F.2 is a version of Fig. 10, adopting an alternative definition of quenched galaxies, and is in broad agreement with the results presented in the main body of this work. Once again, the GAEA2024 model predicts that massive filament galaxies are subject to a rapid quenching process, while the other evolutionary paths are consistent with those of the field population. In the TNG100 model, the field and FF populations are very similar, except for a higher incidence of rejuvenated galaxies in filaments. We therefore conclude that adopting a redshift-dependent definition of the quenched fraction does not affect our results.
All Figures
|
Fig. 1. Four-step method for filament identification at each snapshot. The procedure is illustrated using a zoom-in region with side length 12 Mpc/h, centred on a massive halo with log10(Mhalo/M⊙)[z = 0] = 14.67, at redshift z = 0 in the GAEA2024 model. S1 shows the spatial distribution of all galaxies. S2 presents four random selections, each containing 85% of the galaxy sample. S3 displays the filaments identified by DisPerSE for each corresponding random selection. The final panel, S4, shows all filaments across the four random selections separated by colour. The red lines represent the results of the commonly used approach of running DisPerSE once on all galaxies above the stellar mass threshold for the comparison. |
| In the text | |
|
Fig. 2. Evolution of the filamentary structure around the region that collapses into a log(Mhalo/Msun)≈1014 cluster at z = 0 in the GAEA2024. Different line colours indicate one of the ten sub-GFSs. |
| In the text | |
|
Fig. 3. Cartoon representing filament galaxies’ possible environmental history, as explained in Sect. 3.2. |
| In the text | |
|
Fig. 4. Pie charts showing the fraction of galaxies inside filaments at z = 0 separated by their environmental history and mass for GAEA (top) and TNG100 (bottom). The fraction p and standard error ( |
| In the text | |
|
Fig. 5. Filament infall times of z = 0 filament members are shown by the distribution of infall times (τfils) separated by environmental history and mass at z = 0 for two models. |
| In the text | |
|
Fig. 6. Cumulative mass distribution of the stellar mass of galaxies inside filaments at z = 0 separated by environmental history. The thick grey line shows the corresponding distribution obtained when considering all galaxies in the simulated volume at z = 0. For comparison, the values for the field galaxies are also reported. In each panel, the results of the two-sample KS test comparing filament and field galaxies are reported, including both the KS statistic D and the corresponding p-value. |
| In the text | |
|
Fig. 7. Median cumulative fraction of stellar mass Mstar/Mstar, z = 0 for today’s low-mass (first and second rows) and massive (third and fourth rows) members of filaments categorised by environmental history and infall time into filaments compared to the field galaxies (stellar mass is controlled in each panel). Results are shown for two models with solid lines representing the median and shaded regions indicating uncertainty limits across 100 stellar mass-matched realisations. The vertical lines represent the median time when galaxies build 70% of their mass, with a standard deviation between 100 stellar mass fittings. The number of galaxies in each bin of stellar mass and infall time is given in the top-left corner of each panel. |
| In the text | |
|
Fig. 8. Quenching of the filament populations over time compared to the field population. Quenched fraction of filament population as a function of cosmic time, separated by the environmental history and infall times into filaments (stellar mass is controlled). The galaxy is considered quenched if the sSFR is below 10−11, yr−1. Results are shown for two models, with solid lines representing the median and shaded regions indicating uncertainty limits (16th–84th percentiles) across 100 stellar mass-matched realisations. We note that for the GAEA2024 model, the star formation rate was time averaged, and for TNG100, it was instantaneous. Therefore, comparisons between the models at this stage should be interpreted qualitatively. The number of galaxies in each bin of stellar mass and infall time is given in the top-left corner of each panel. |
| In the text | |
|
Fig. 9. Merger rate for filament members that fell into filaments more than 9 Gyr ago. The lines represent the median number of major (solid line) and minor (dotted line) mergers per galaxy per 1 Gyr as a function of cosmic time, categorised by environmental history when stellar mass is controlled. The values represent the total number of major mergers, normalised by the total number of galaxies considered. The figure shows the median across realisations with the 16th–84th percentile interval. |
| In the text | |
|
Fig. 10. Distribution of the fraction of galaxy types by star formation or quenching status presented for galaxies within filaments (FF) and fields at z = 0, with stellar mass controlled. Only massive galaxies that fell into filaments more than 9 Gyr ago are included. Populations are categorised into star-forming, rejuvenated, fast-quenched, and slow-quenched based on the evolution of their sSFR. |
| In the text | |
|
Fig. A.1. Distributions of the per-galaxy quartile coefficient of dispersion (QCD = (Q75 − Q25)/(Q75 + Q25) ), computed from ten independent distance-to-filament estimates for each galaxy, at z = 0, z = 1, z = 2, and z = 4. Vertical lines mark the bootstrap median QCD for each redshift; lower values indicate better convergence. |
| In the text | |
|
Fig. B.1. Difference between the infall time into groups, τgroup infall, and the infall time onto filaments,τfils, for the filament populations (FGF, FFG, and FF-B). |
| In the text | |
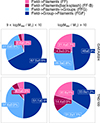 |
Fig. C.1. Same as Fig. 4 but when filaments members are considered at the distance 0.5 Mpc/h. |
| In the text | |
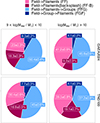 |
Fig. C.2. Same as Fig. 4 but when filaments members are considered at the distance 2 Mpc/h. |
| In the text | |
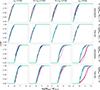 |
Fig. D.1. Same as Fig. 6, but further split into bins of infall time into filaments. |
| In the text | |
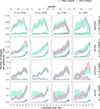 |
Fig. E.1. Same as Fig. 9 but for all τfils bins. |
| In the text | |
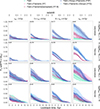 |
Fig. F.1. Same as Fig. 8, but galaxies are considered quenched when sSFR < 3/tH. |
| In the text | |
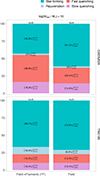 |
Fig. F.2. Same as Fig. 10, but galaxies are considered quenched when sSFR < 3/tH. |
| In the text | |
Current usage metrics show cumulative count of Article Views (full-text article views including HTML views, PDF and ePub downloads, according to the available data) and Abstracts Views on Vision4Press platform.
Data correspond to usage on the plateform after 2015. The current usage metrics is available 48-96 hours after online publication and is updated daily on week days.
Initial download of the metrics may take a while.