Open Access
Fig. A.1.
Download original image
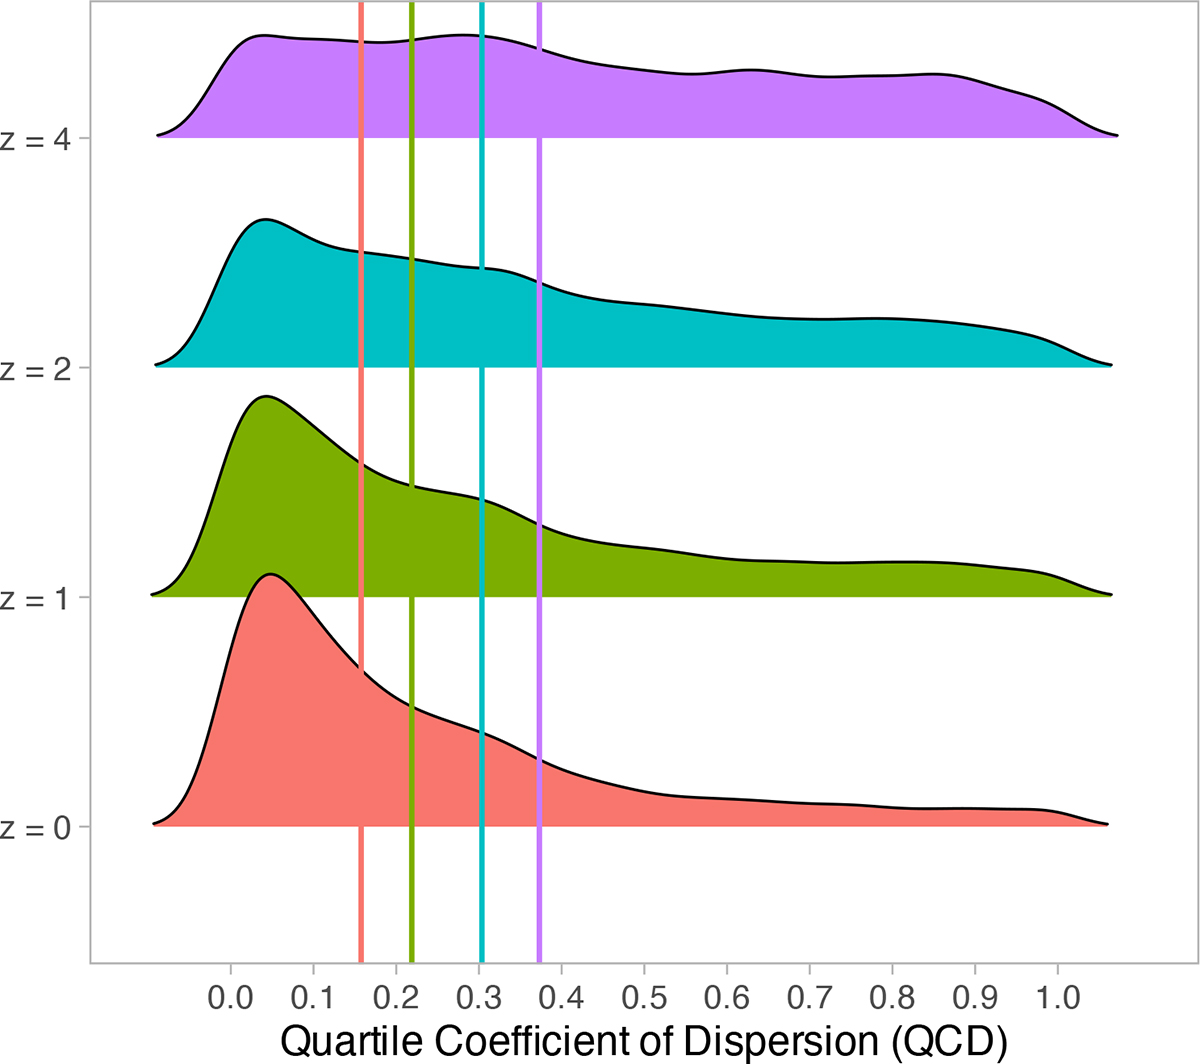
Distributions of the per-galaxy quartile coefficient of dispersion (QCD = (Q75 − Q25)/(Q75 + Q25) ), computed from ten independent distance-to-filament estimates for each galaxy, at z = 0, z = 1, z = 2, and z = 4. Vertical lines mark the bootstrap median QCD for each redshift; lower values indicate better convergence.
Current usage metrics show cumulative count of Article Views (full-text article views including HTML views, PDF and ePub downloads, according to the available data) and Abstracts Views on Vision4Press platform.
Data correspond to usage on the plateform after 2015. The current usage metrics is available 48-96 hours after online publication and is updated daily on week days.
Initial download of the metrics may take a while.