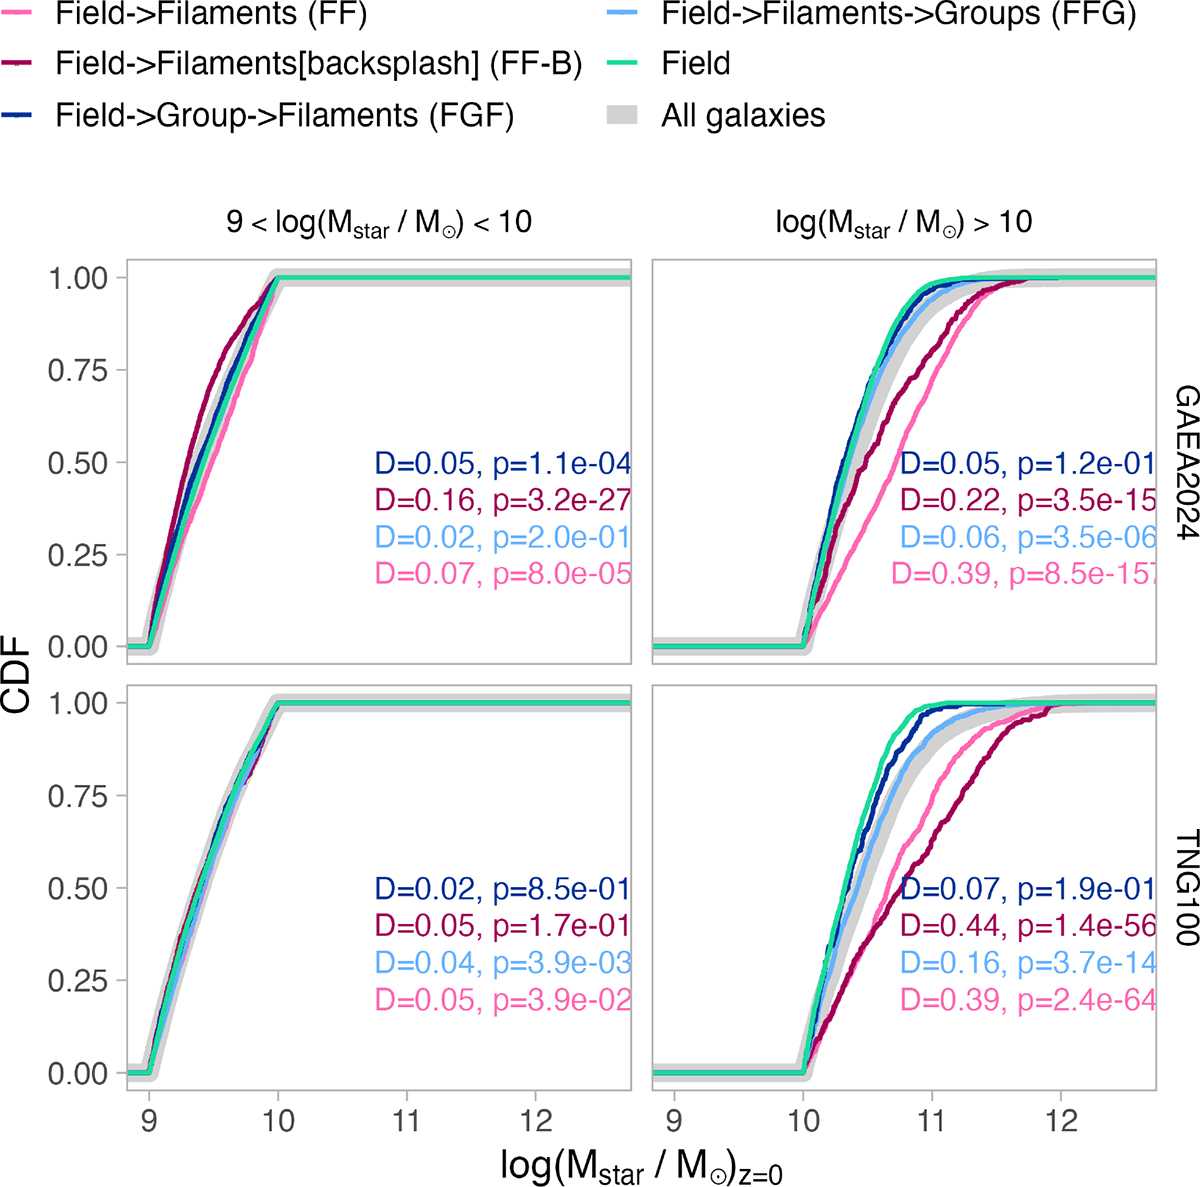
Fig. 6.
Download original image
Cumulative mass distribution of the stellar mass of galaxies inside filaments at z = 0 separated by environmental history. The thick grey line shows the corresponding distribution obtained when considering all galaxies in the simulated volume at z = 0. For comparison, the values for the field galaxies are also reported. In each panel, the results of the two-sample KS test comparing filament and field galaxies are reported, including both the KS statistic D and the corresponding p-value.
Current usage metrics show cumulative count of Article Views (full-text article views including HTML views, PDF and ePub downloads, according to the available data) and Abstracts Views on Vision4Press platform.
Data correspond to usage on the plateform after 2015. The current usage metrics is available 48-96 hours after online publication and is updated daily on week days.
Initial download of the metrics may take a while.