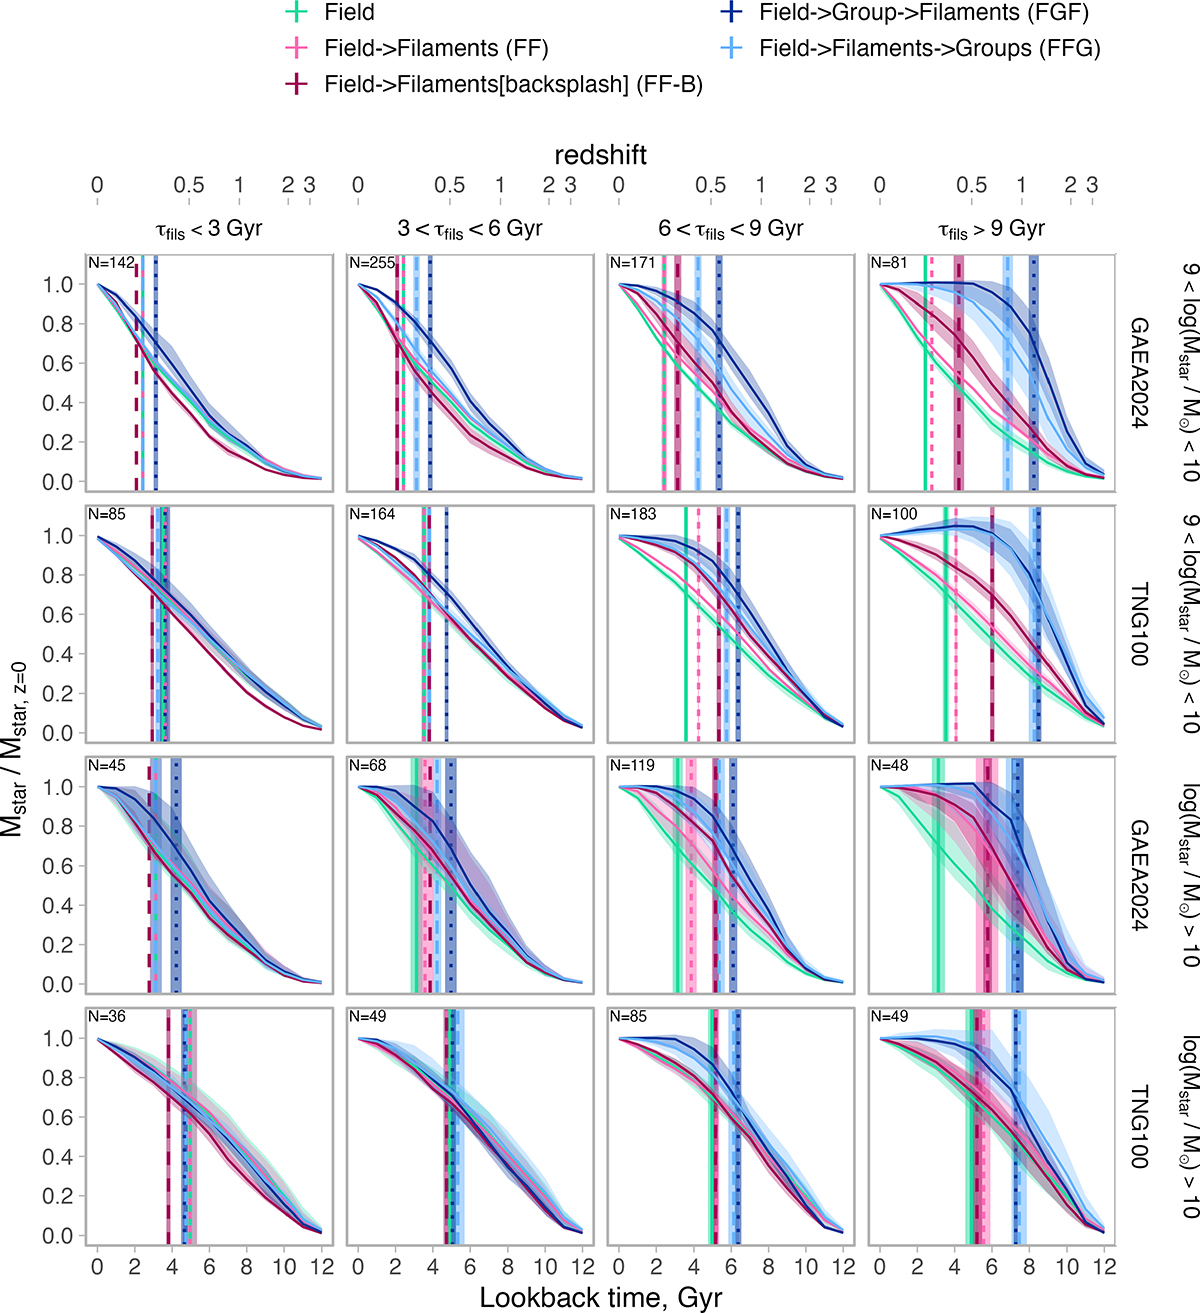
Fig. 7.
Download original image
Median cumulative fraction of stellar mass Mstar/Mstar, z = 0 for today’s low-mass (first and second rows) and massive (third and fourth rows) members of filaments categorised by environmental history and infall time into filaments compared to the field galaxies (stellar mass is controlled in each panel). Results are shown for two models with solid lines representing the median and shaded regions indicating uncertainty limits across 100 stellar mass-matched realisations. The vertical lines represent the median time when galaxies build 70% of their mass, with a standard deviation between 100 stellar mass fittings. The number of galaxies in each bin of stellar mass and infall time is given in the top-left corner of each panel.
Current usage metrics show cumulative count of Article Views (full-text article views including HTML views, PDF and ePub downloads, according to the available data) and Abstracts Views on Vision4Press platform.
Data correspond to usage on the plateform after 2015. The current usage metrics is available 48-96 hours after online publication and is updated daily on week days.
Initial download of the metrics may take a while.