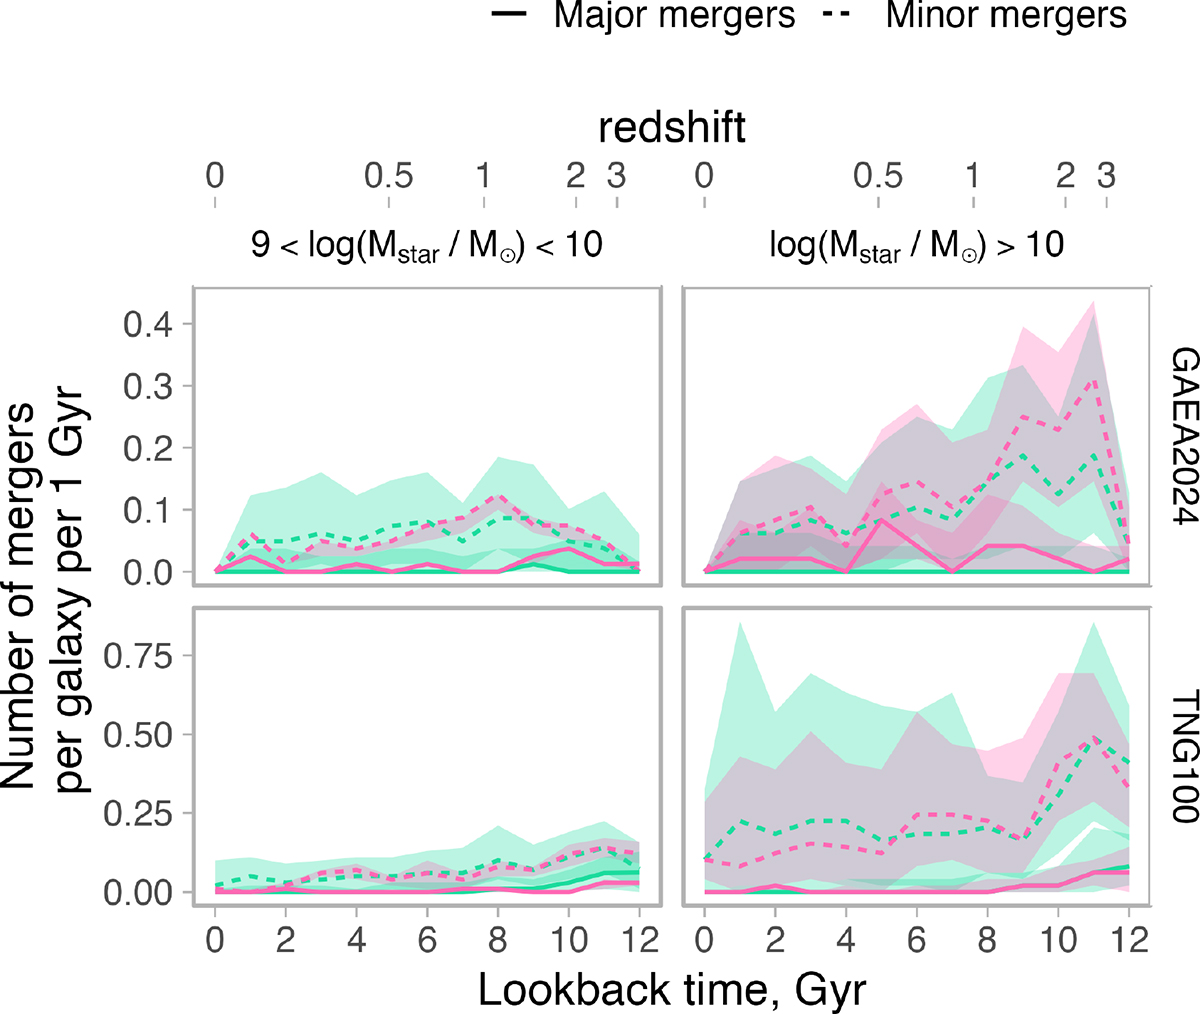
Fig. 9.
Download original image
Merger rate for filament members that fell into filaments more than 9 Gyr ago. The lines represent the median number of major (solid line) and minor (dotted line) mergers per galaxy per 1 Gyr as a function of cosmic time, categorised by environmental history when stellar mass is controlled. The values represent the total number of major mergers, normalised by the total number of galaxies considered. The figure shows the median across realisations with the 16th–84th percentile interval.
Current usage metrics show cumulative count of Article Views (full-text article views including HTML views, PDF and ePub downloads, according to the available data) and Abstracts Views on Vision4Press platform.
Data correspond to usage on the plateform after 2015. The current usage metrics is available 48-96 hours after online publication and is updated daily on week days.
Initial download of the metrics may take a while.