Open Access
Fig. A.5.
Download original image
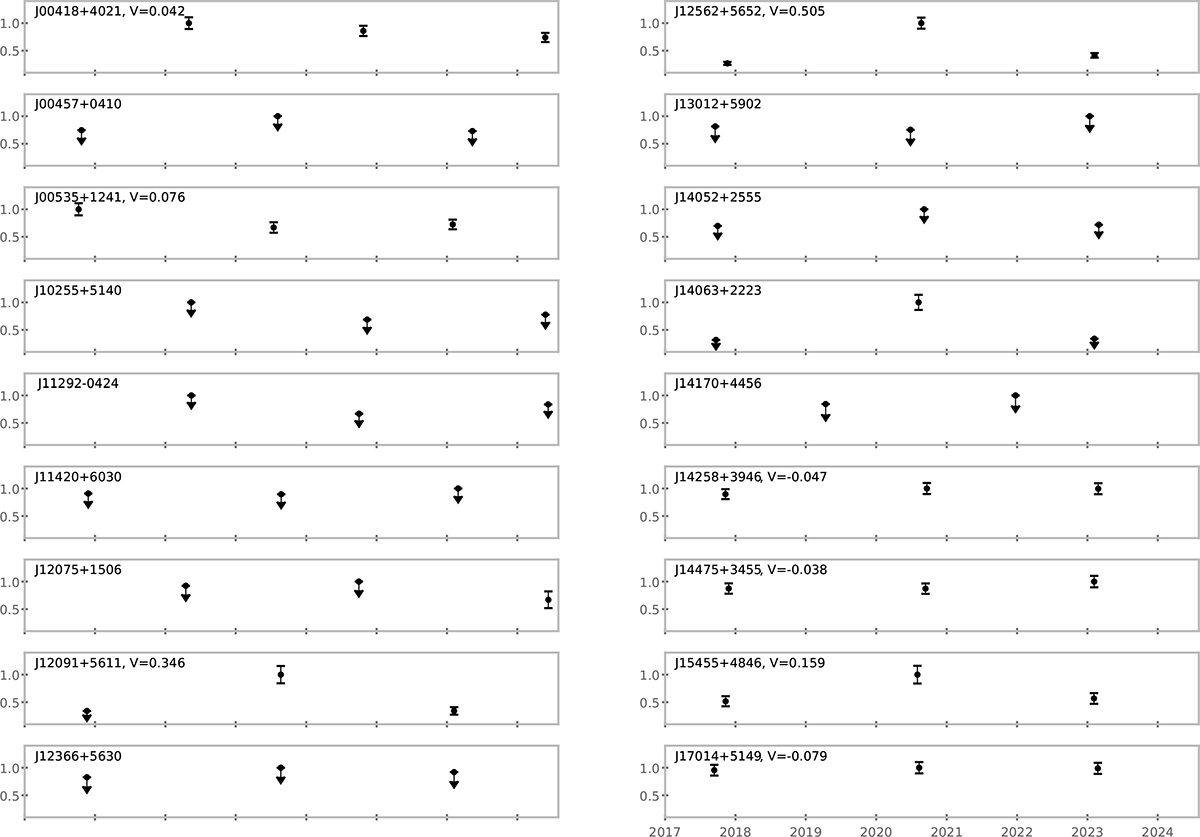
Sources variability across VLASS observations. Fluxes have been normalized by the maximum flux observed with VLASS, and the variability index V is shown for sources with detections in at least two epochs.
Current usage metrics show cumulative count of Article Views (full-text article views including HTML views, PDF and ePub downloads, according to the available data) and Abstracts Views on Vision4Press platform.
Data correspond to usage on the plateform after 2015. The current usage metrics is available 48-96 hours after online publication and is updated daily on week days.
Initial download of the metrics may take a while.