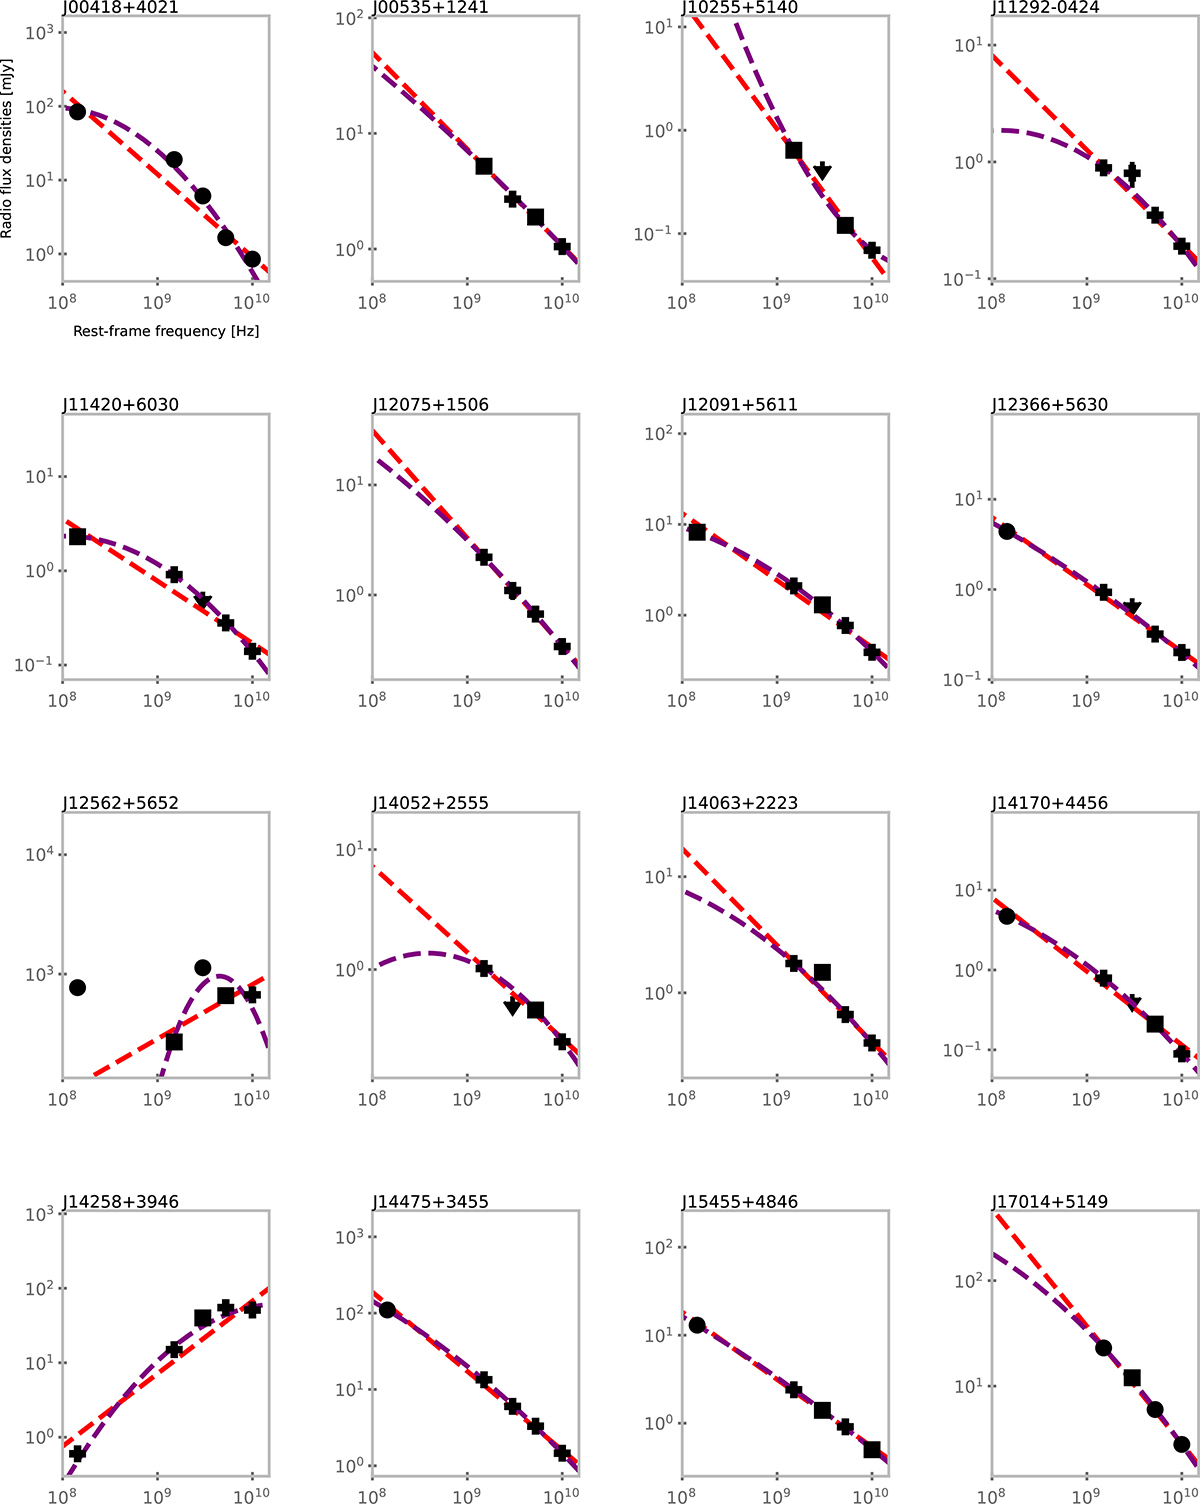
Fig. B.1.
Download original image
The radio spectra of the 16 sources detected in three bands or more. The dashed red line indicate the linear fit while the dashed purple line present the parabolic fit. Upper limits are shown but have been excluded during fitting procedure. The marker shape indicate the morphology of the source at the given frequency : circle for extended, square for intermediates and cross for compact sources.
Current usage metrics show cumulative count of Article Views (full-text article views including HTML views, PDF and ePub downloads, according to the available data) and Abstracts Views on Vision4Press platform.
Data correspond to usage on the plateform after 2015. The current usage metrics is available 48-96 hours after online publication and is updated daily on week days.
Initial download of the metrics may take a while.