Fig. C.2.
Download original image
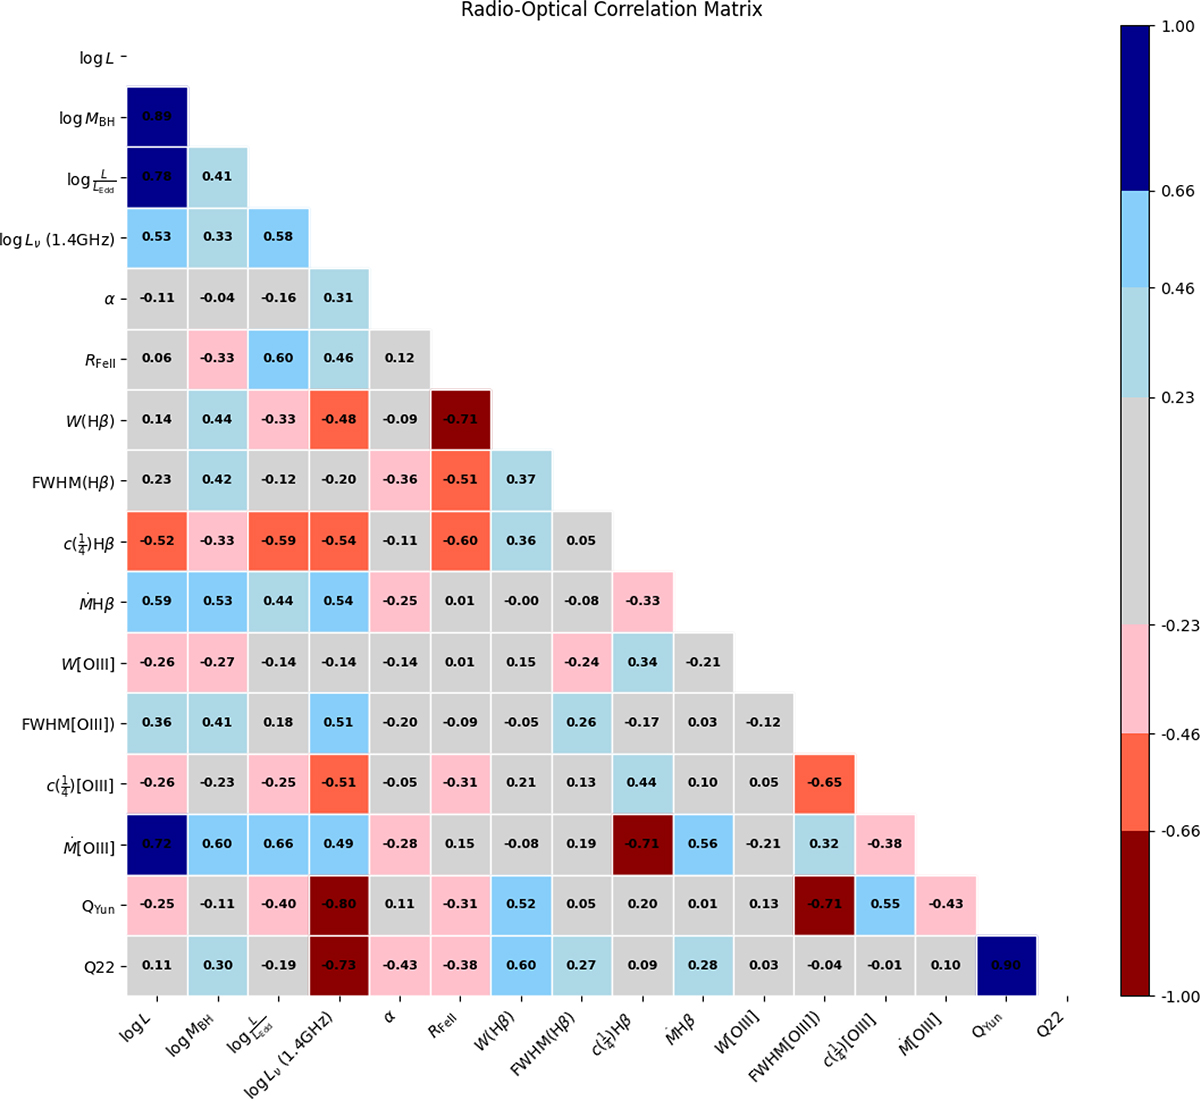
Correlation matrix (Pearson’s) involving the main optical (Hβ and [O III]λ5007), radio and IR derived parameters. The limits in the color ranges correspond to a statistical significance of ±1, 2, 3σ for the Pearson’s correlation coefficient computed for 18 objects. The parameters considered are in this order, the bolometric luminosity L, the black hole mass MBH, the Eddington ratio L/LEdd, the radio power at 1.4 GHz, the radio spectral index α, Fe II prominence ratio RFeII, the equivalent with of Hβ (broad components), its FWHM and centroid displacement at one-half peak intensity ![]() , the mass outflow rate measured from blueshift emission of Hβ, Ṁ; the equivalent width, FWHM,
, the mass outflow rate measured from blueshift emission of Hβ, Ṁ; the equivalent width, FWHM, ![]() , Ṁ of the [O III]λ5007 line; the Q parameters defined according to Yun et al. (2001) and to Eq. (5).
, Ṁ of the [O III]λ5007 line; the Q parameters defined according to Yun et al. (2001) and to Eq. (5).
Current usage metrics show cumulative count of Article Views (full-text article views including HTML views, PDF and ePub downloads, according to the available data) and Abstracts Views on Vision4Press platform.
Data correspond to usage on the plateform after 2015. The current usage metrics is available 48-96 hours after online publication and is updated daily on week days.
Initial download of the metrics may take a while.