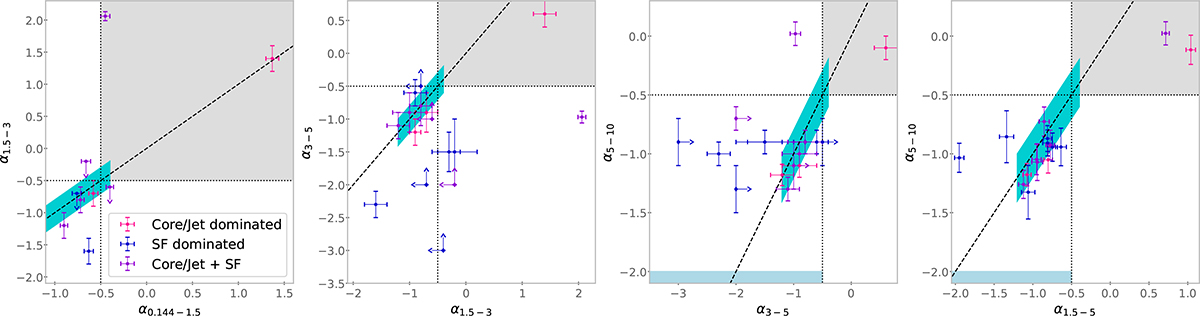
Fig. 3.
Download original image
Spectral indices plotted as α1.5 − 5 vs. α0.144 − 1.5, α3 − 5 vs. α1.5 − 3, α5 − 10 vs. α3 − 5, and α5 − 10 vs. α1.5 − 5. Markers are colored according to the dominating mechanism responsible for the detected radio emission (Table 2). The dashed line indicates the 1 : 1 ratio of equal slopes, while the horizontal and vertical dotted lines correspond to α = −0.5. The region showing flat or inverted spectra, which may be associated with a core-dominated jet or a corona, is shaded gray. The region with a spectral index α = −0.8 ± 0.4 and a scatter of 0.2, possibly related to SF, is shaded turquoise. The region showing very steep spectral slopes with α5 − 10 < −2 in the right-hand panel, which may imply possible relic emission, is shaded blue.
Current usage metrics show cumulative count of Article Views (full-text article views including HTML views, PDF and ePub downloads, according to the available data) and Abstracts Views on Vision4Press platform.
Data correspond to usage on the plateform after 2015. The current usage metrics is available 48-96 hours after online publication and is updated daily on week days.
Initial download of the metrics may take a while.