Open Access
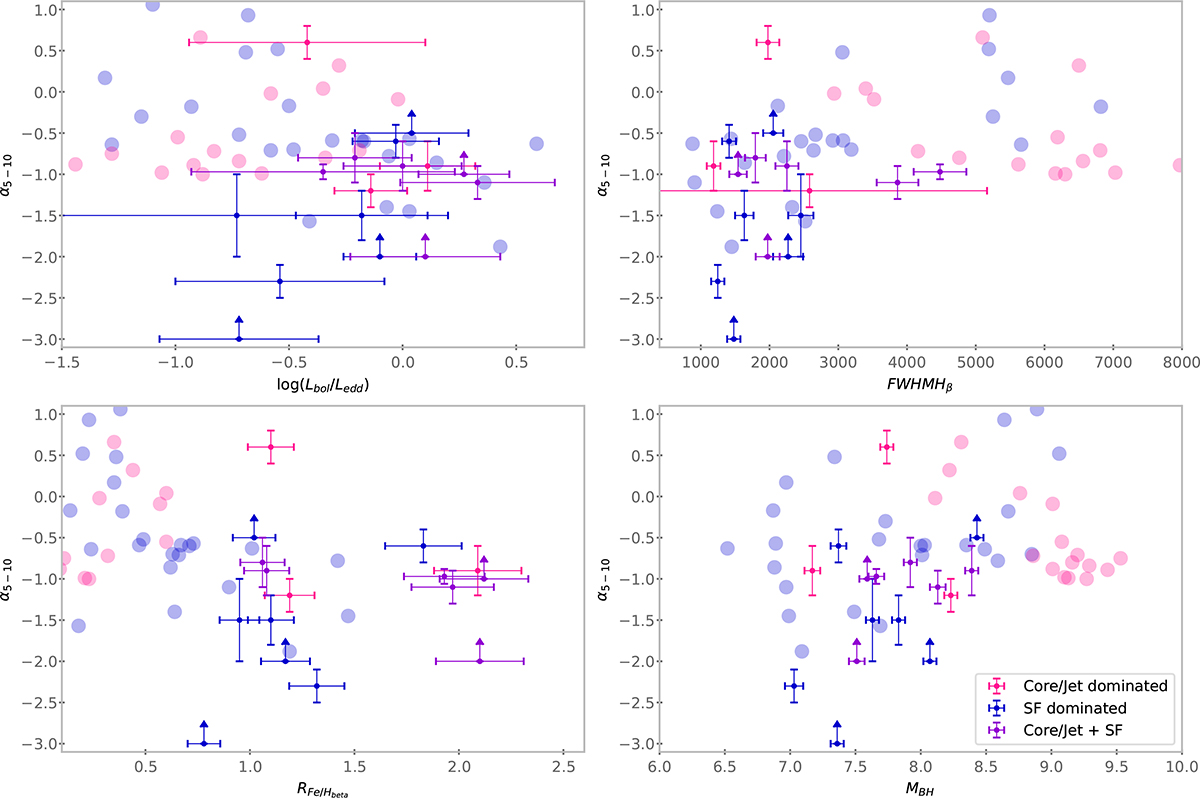
Fig. 7.
Download original image
Spectral index α5 − 10 vs. the Eddington ratio, the FWHM of the Hβ line (in km/s), the flux ratio RFeII, and MBH. Markers are colored according to the dominant mechanism responsible for the detected radio emission (Table 2). Blue and pink filled circles indicate RQ and RL quasars, respectively, from Laor et al. (2019).
Current usage metrics show cumulative count of Article Views (full-text article views including HTML views, PDF and ePub downloads, according to the available data) and Abstracts Views on Vision4Press platform.
Data correspond to usage on the plateform after 2015. The current usage metrics is available 48-96 hours after online publication and is updated daily on week days.
Initial download of the metrics may take a while.