Fig. 1.
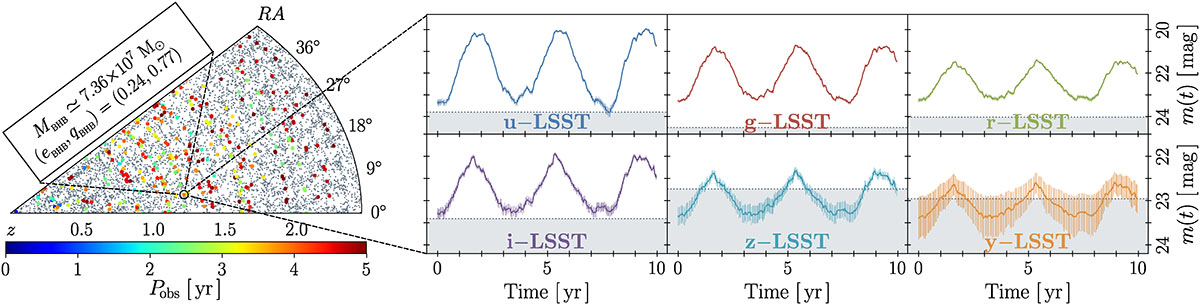
Download original image
Left panel: Thin slice of the simulated light cone. The coloured points correspond to MBHBs with Pobs ≤ 5 yr, while the black points represent all other galaxies hosted in the lightcone. We note that the lightcone slice shows some spatial periodicity of structures, which results from the box replication needed to build a wide and deep lightcone with the MSII merger trees. Right panels: Light curves in the LSST bands (u, g, r, i, z, y) associated with a MBHB at redshift ∼1.22 with mass ∼7.3 × 10⁷ M⊙, mass ratio ∼0.77 and eccentricity ∼0.24. The error bars correspond to the associated photometric uncertainty. The modelling and construction of the MBHB emission is illustrated in detail in Sections 3–4.
Current usage metrics show cumulative count of Article Views (full-text article views including HTML views, PDF and ePub downloads, according to the available data) and Abstracts Views on Vision4Press platform.
Data correspond to usage on the plateform after 2015. The current usage metrics is available 48-96 hours after online publication and is updated daily on week days.
Initial download of the metrics may take a while.