Fig. 2.
Download original image
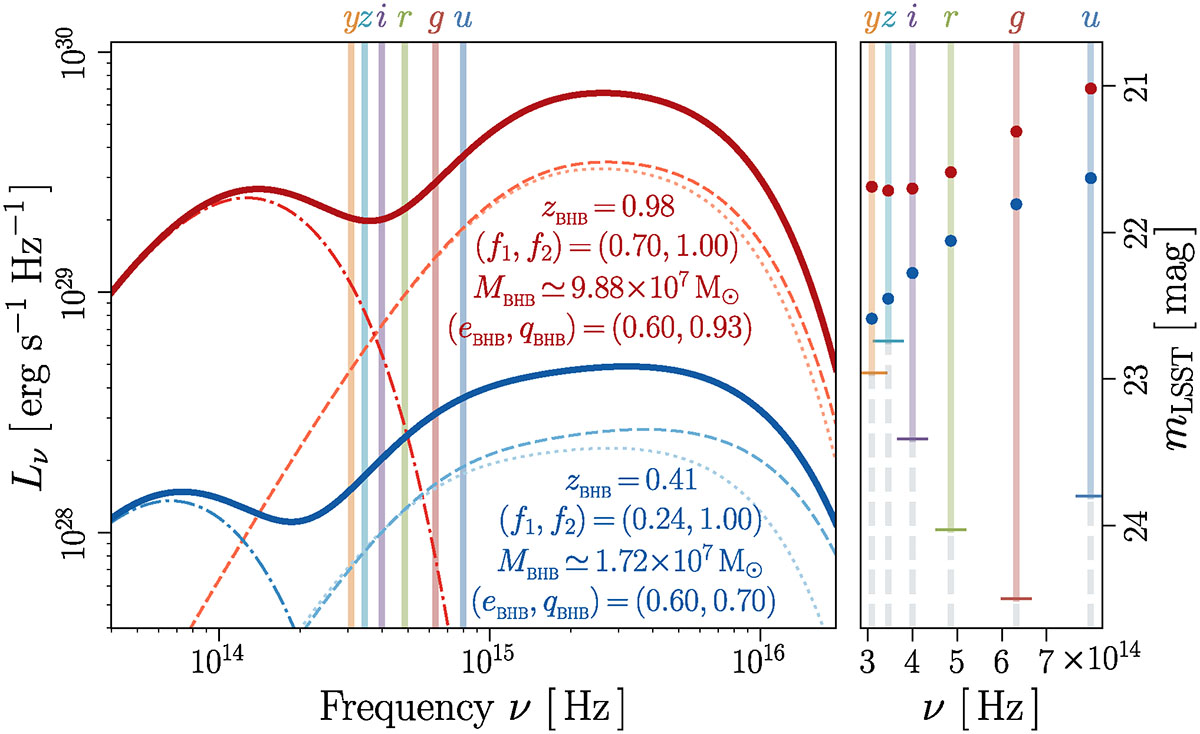
Left panel: Spectral energy distribution (SED) of two selected MBHBs from our lightcone. The dashed, dotted and dash-dotted lines correspond to ![]() ,
, ![]() and
and ![]() , respectively. The solid lines correspond to the total SED (Lν). Right panel: Apparent magnitudes in the LSST bands (mLSST) associated with the SEDs of the left panels (coloured dots). The vertical lines locate the LSST filter central wavelengths. The horizontal coloured ticks indicate the filter sensitivities, while the grey dashed lines highlight the non-detectable magnitudes.
, respectively. The solid lines correspond to the total SED (Lν). Right panel: Apparent magnitudes in the LSST bands (mLSST) associated with the SEDs of the left panels (coloured dots). The vertical lines locate the LSST filter central wavelengths. The horizontal coloured ticks indicate the filter sensitivities, while the grey dashed lines highlight the non-detectable magnitudes.
Current usage metrics show cumulative count of Article Views (full-text article views including HTML views, PDF and ePub downloads, according to the available data) and Abstracts Views on Vision4Press platform.
Data correspond to usage on the plateform after 2015. The current usage metrics is available 48-96 hours after online publication and is updated daily on week days.
Initial download of the metrics may take a while.