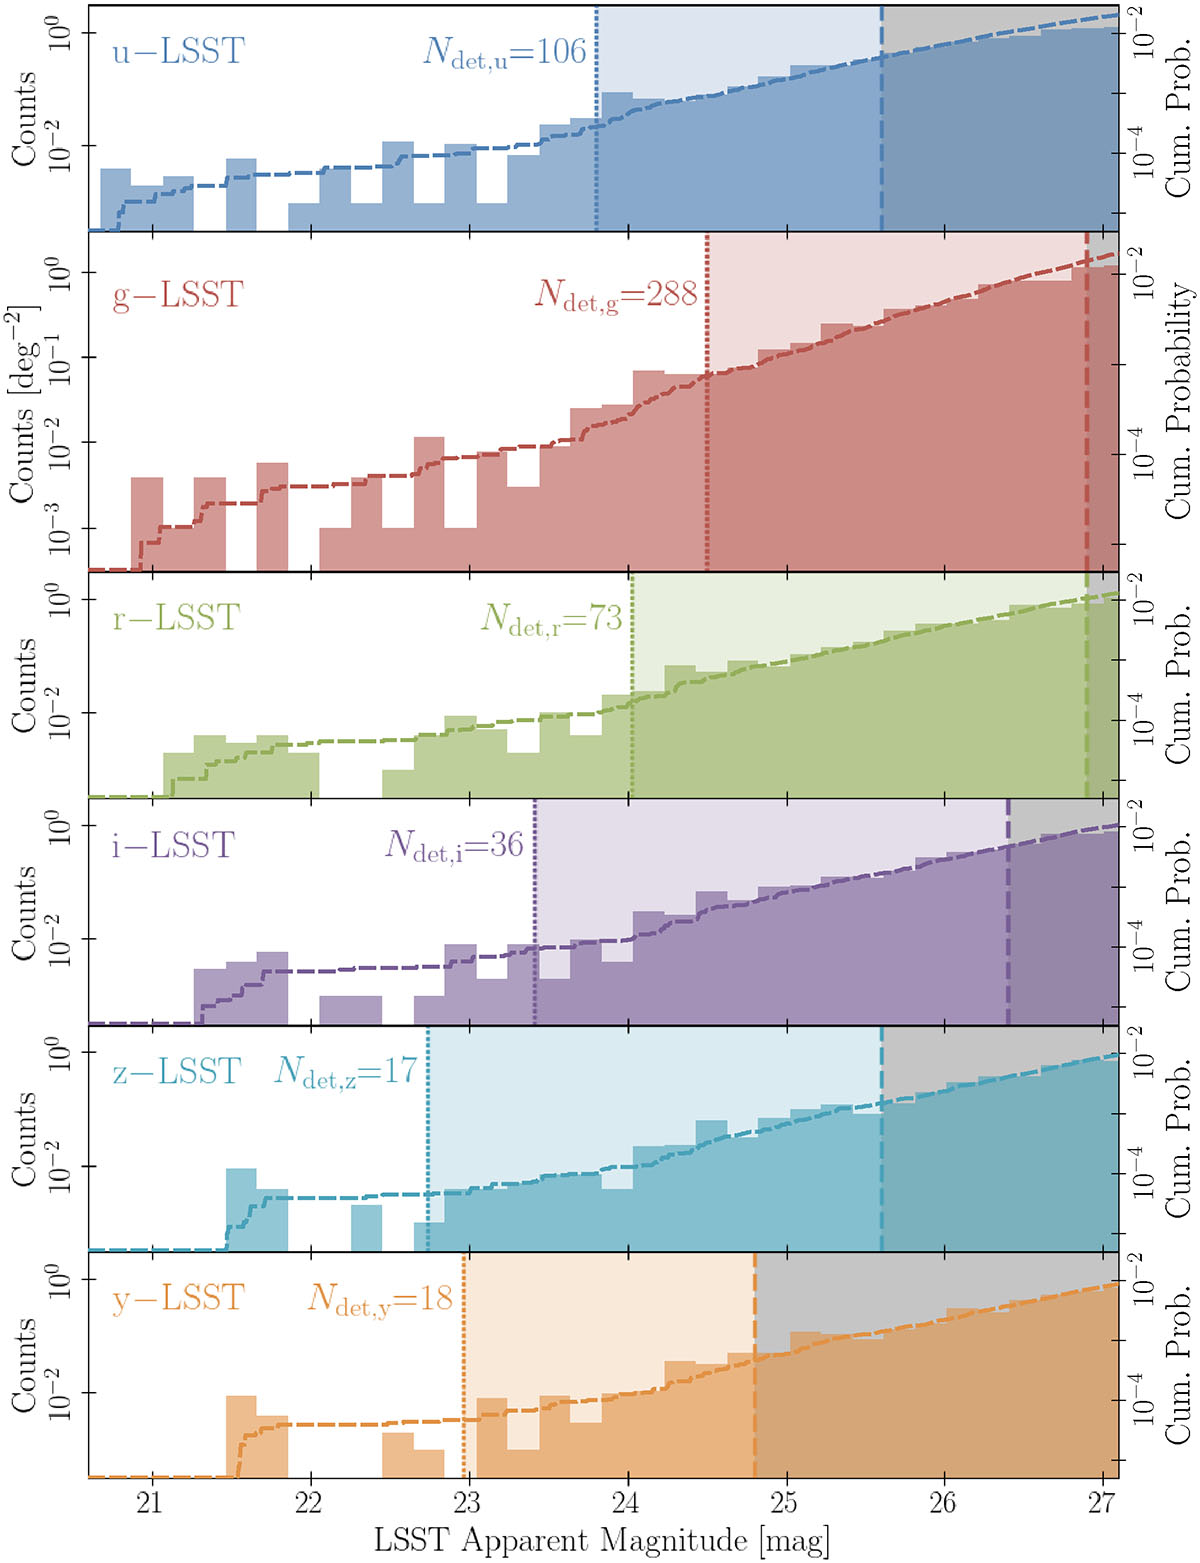
Fig. 3.
Download original image
Distribution of MBHBs per deg2 as a function of magnitude. The vertical dotted and dashed lines correspond to the limiting magnitude of single and 10 yr co-added exposure modes, respectively. The dashed lines illustrate the cumulative probability functions of the full Pobs ≤ 5 yr MBHB population. In each panel, we show the number of MBHBs that are detectable in a single LSST exposure (Ndet, k, k ∈ { u, g, r, i, z, y }).
Current usage metrics show cumulative count of Article Views (full-text article views including HTML views, PDF and ePub downloads, according to the available data) and Abstracts Views on Vision4Press platform.
Data correspond to usage on the plateform after 2015. The current usage metrics is available 48-96 hours after online publication and is updated daily on week days.
Initial download of the metrics may take a while.