Open Access
Fig. 5.
Download original image
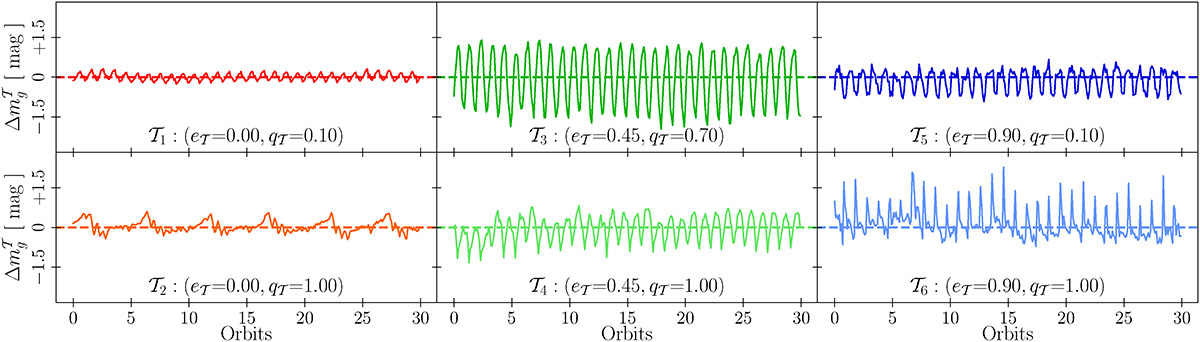
Visualisation of the g-band variability prescribed by our templates, Δmg𝒯(z = 1), as a function of the last 30 orbits. Each panel represents a different hydrodynamical simulation from Cocchiararo et al. (2024). The template parameters (e𝒯, q𝒯) are shown in each panel.
Current usage metrics show cumulative count of Article Views (full-text article views including HTML views, PDF and ePub downloads, according to the available data) and Abstracts Views on Vision4Press platform.
Data correspond to usage on the plateform after 2015. The current usage metrics is available 48-96 hours after online publication and is updated daily on week days.
Initial download of the metrics may take a while.