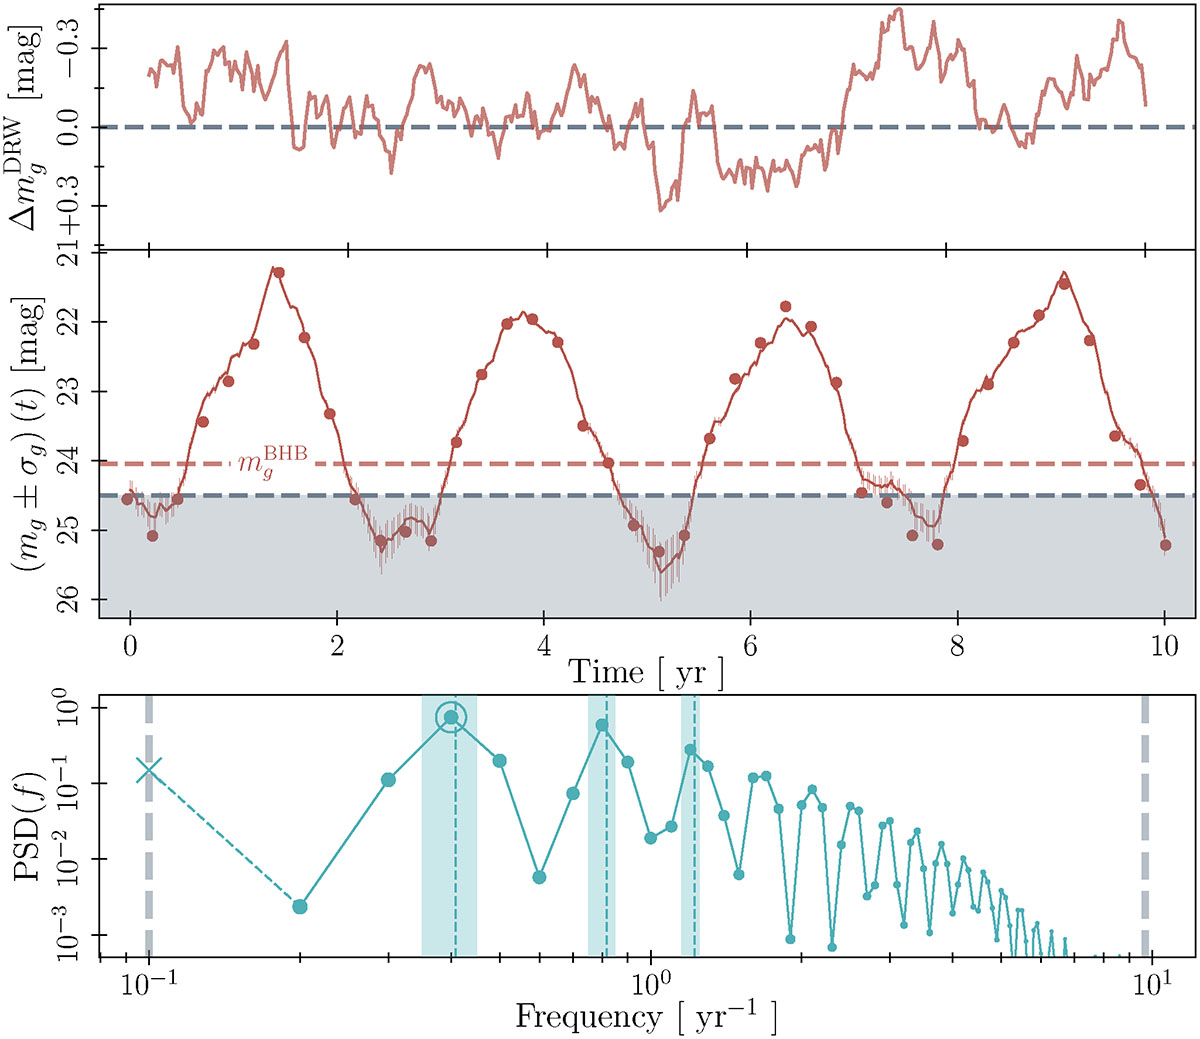
Fig. 6.
Download original image
Example of light curve construction in the LSST g-band. The selected source features MBHB ≃ 4.91 × 10⁷ M⊙, zBHB ≃ 1.95, Pobs ≃ 2.45 yr, eBHB = 0.6, and qBHB ≃ 0.7. First panel: Random DRW realisation associated with the MBHB. Second panel: Realisation of a single mg(t) light curve. The dots represent the tailored 𝒯3 data points. The solid line implements the DRW shift from the first panel, plus the manipulations presented in Sections 4.1–4.4. Third panel: Periodogram analysis of mg(t). The vertical green dashed lines represent the Keplerian frequency and the second and third harmonics, while the corresponding shaded regions represent the frequency bin width. Finally, the vertical thick shaded grey lines mark the periodogram fmin and fmax values.
Current usage metrics show cumulative count of Article Views (full-text article views including HTML views, PDF and ePub downloads, according to the available data) and Abstracts Views on Vision4Press platform.
Data correspond to usage on the plateform after 2015. The current usage metrics is available 48-96 hours after online publication and is updated daily on week days.
Initial download of the metrics may take a while.