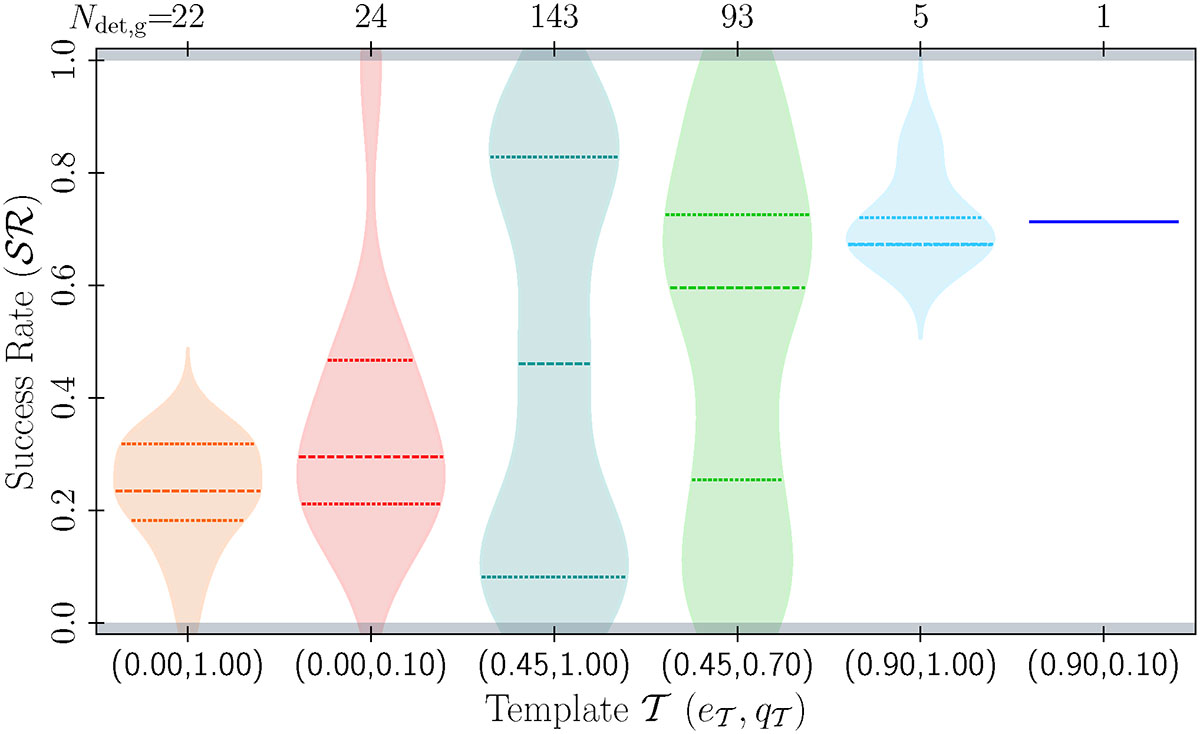
Fig. 7.
Download original image
Success rate of detecting MBHBs via variability studies in the g-band of LSST. The results are presented as a function of the MBHB properties, grouped according to the associated template. We used a total NR = 105 light curves for each MBHB, which in turn yielded a single 𝒮ℛ value per object. Each distribution thus contains Ndet, g entries. The coloured regions represent the total distribution while the horizontal segments locate the 25th, 50th, and 75th quantiles of each distribution.
Current usage metrics show cumulative count of Article Views (full-text article views including HTML views, PDF and ePub downloads, according to the available data) and Abstracts Views on Vision4Press platform.
Data correspond to usage on the plateform after 2015. The current usage metrics is available 48-96 hours after online publication and is updated daily on week days.
Initial download of the metrics may take a while.