Fig. 1
Download original image
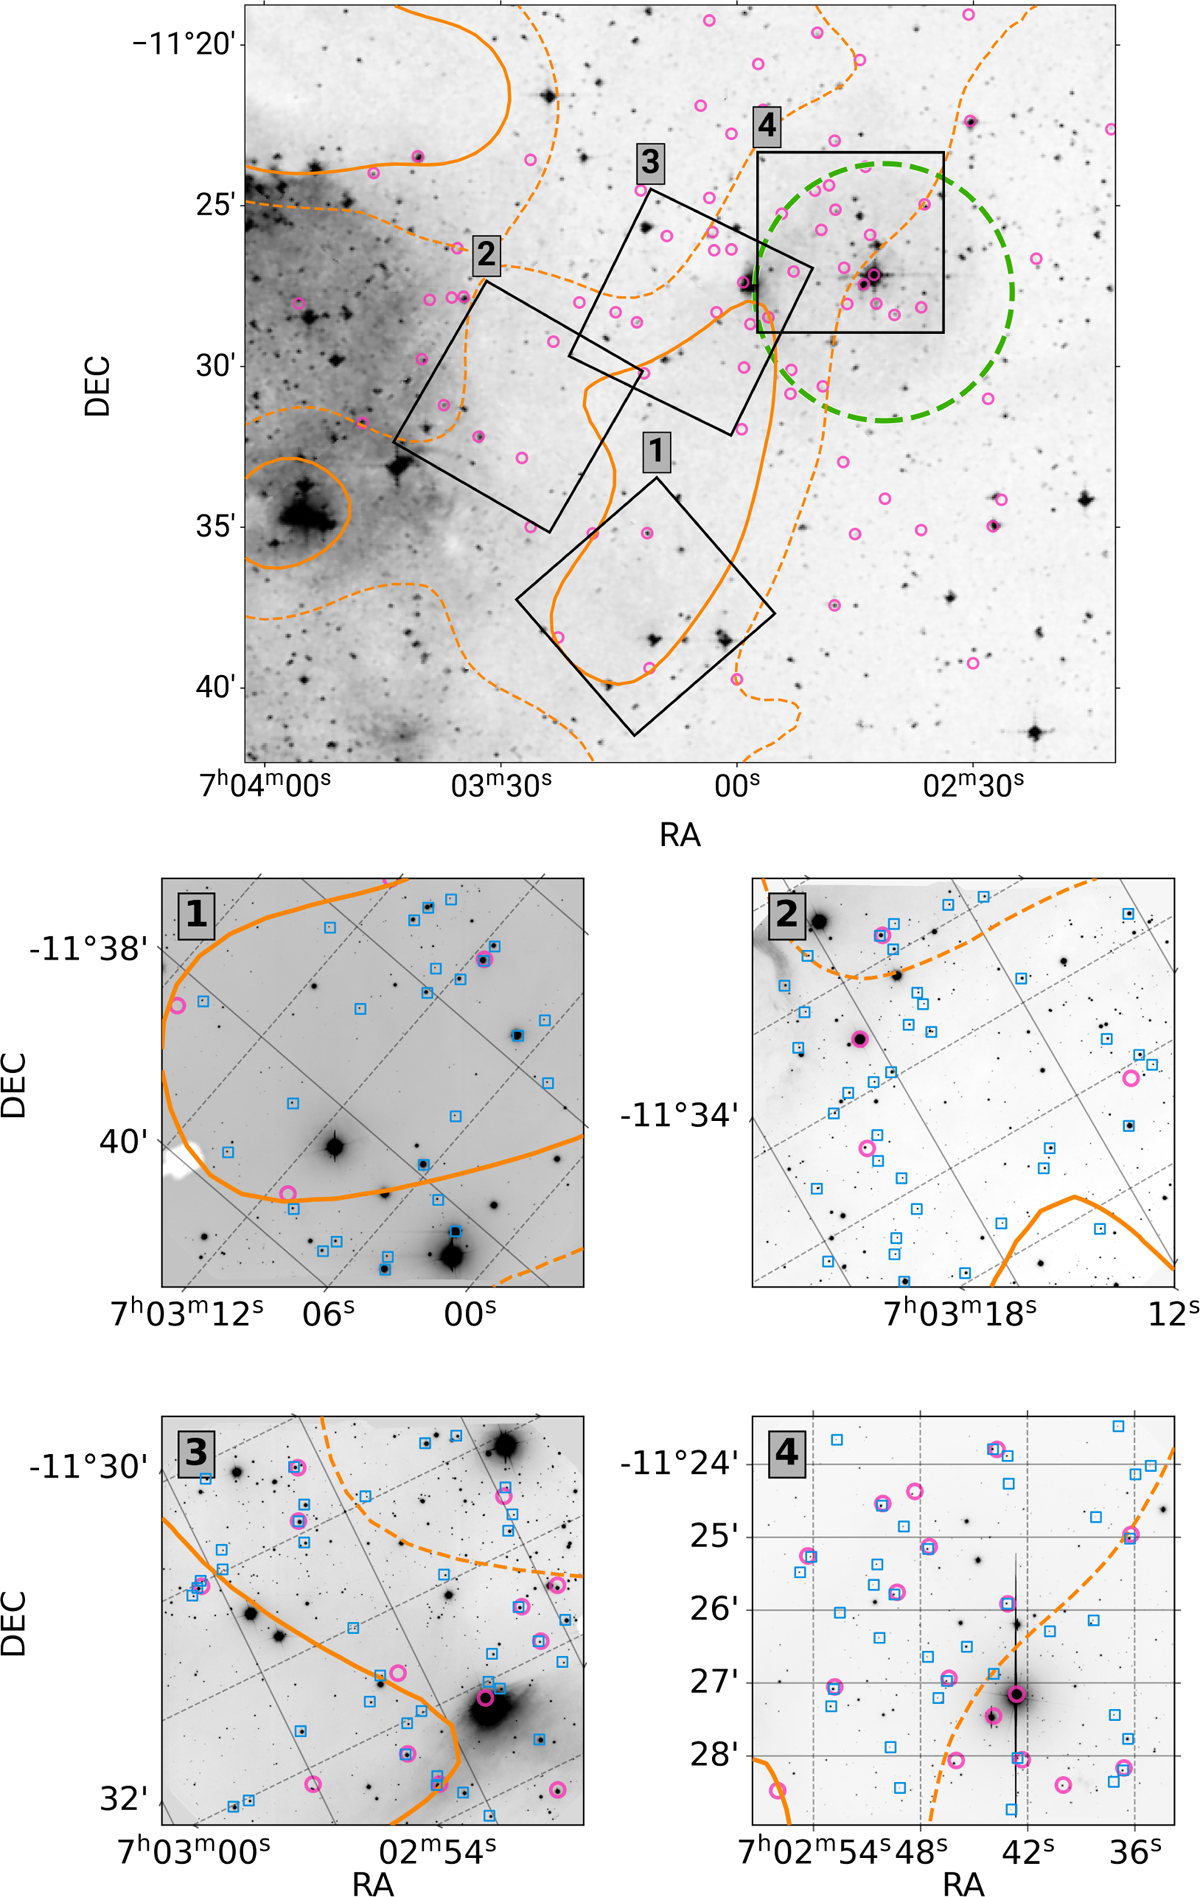
Top panel: optical (Digitized Sky Survey – DSS2, F+R) image of the region studied in this work. The black squares indicate the GMOS 1–4 fields of Table 1. The dashed green circle shows the Sh 2-295 H II region (Sharpless 1959). Bottom panel: GMOS R pre-images used to prepare GMOS masks. To facilitate the identification of the co-ordinate system orientation in each image, the grid lines corresponding to RA and Dec are plotted in grey as dashed and solid lines, respectively. The position of the slits are shown by open blue squares. In both panels, orange lines represent AV = 1 and AV = 3 mag contours (Cambrésy, priv. commun.) and open magenta circles indicate X-ray sources (Santos-Silva et al. 2018). Note that not all X-ray sources were covered by the GMOS observations.
Current usage metrics show cumulative count of Article Views (full-text article views including HTML views, PDF and ePub downloads, according to the available data) and Abstracts Views on Vision4Press platform.
Data correspond to usage on the plateform after 2015. The current usage metrics is available 48-96 hours after online publication and is updated daily on week days.
Initial download of the metrics may take a while.