Open Access
Fig. 2
Download original image
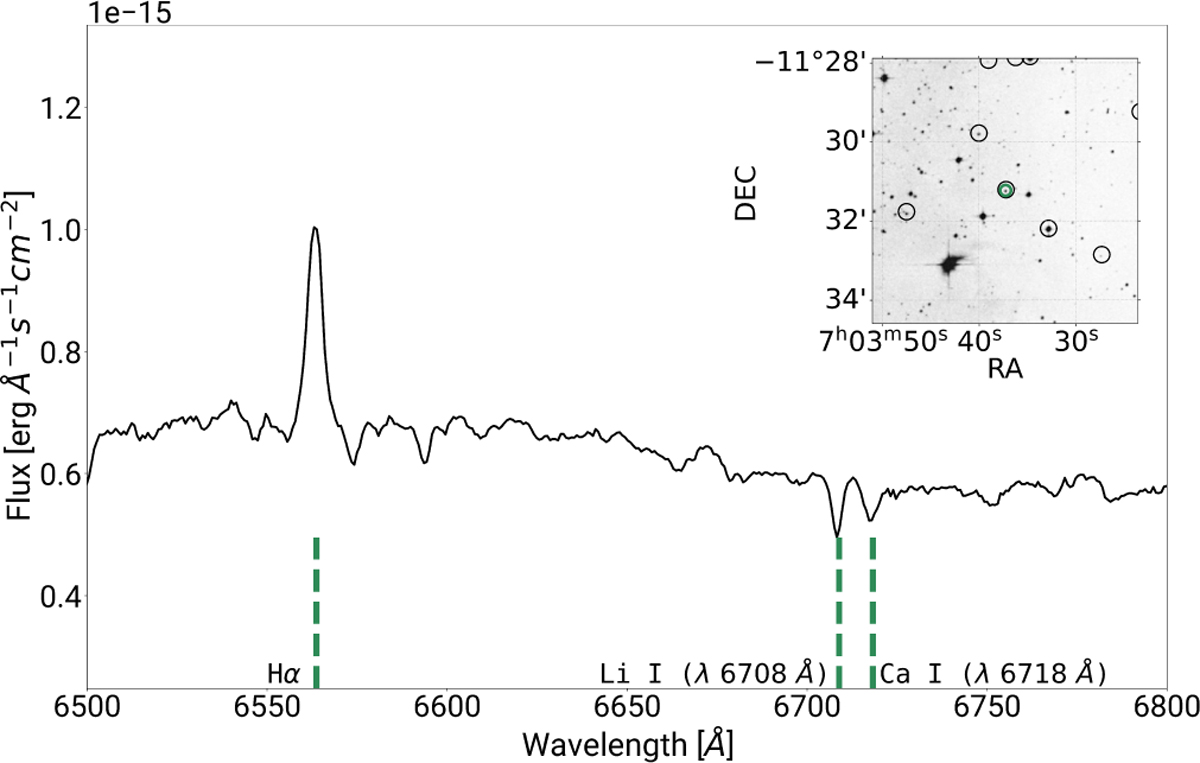
Example of a GMOS spectrum highlighting Hα emission, and Li I (λ6708 Å) and Ca I (λ6718 Å) absorption features. The top right panel shows the angular position of a TTs (green circle) compared to X-ray sources (black circles – Santos-Silva et al. 2018), confirming it as an X-ray counterpart.
Current usage metrics show cumulative count of Article Views (full-text article views including HTML views, PDF and ePub downloads, according to the available data) and Abstracts Views on Vision4Press platform.
Data correspond to usage on the plateform after 2015. The current usage metrics is available 48-96 hours after online publication and is updated daily on week days.
Initial download of the metrics may take a while.