Fig. 3
Download original image
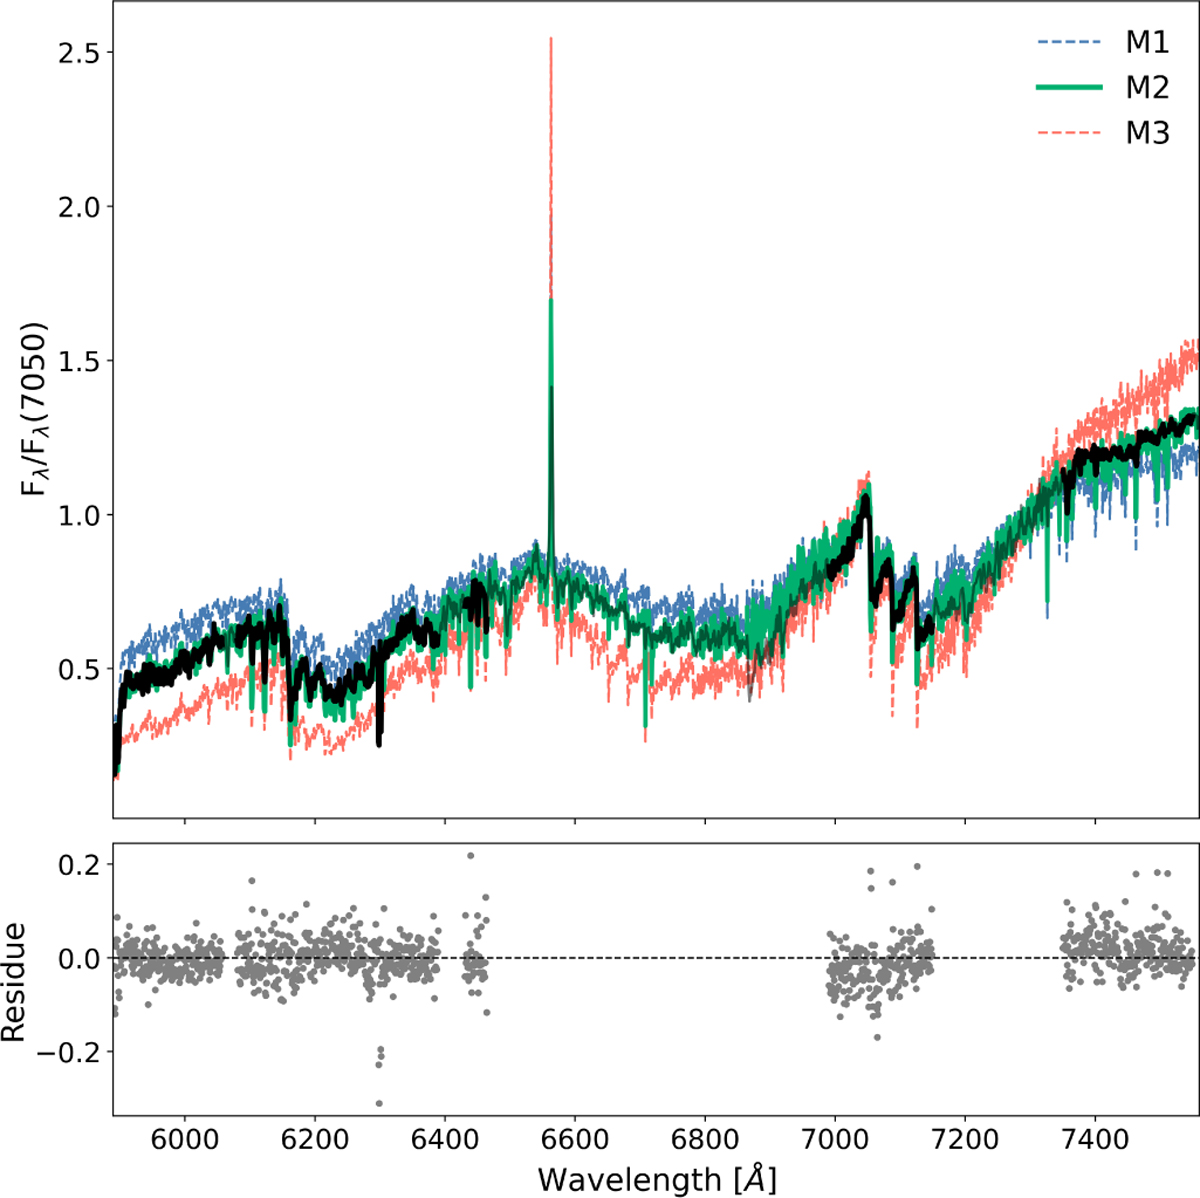
Example of spectral typing via spectral comparison. The GMOS spectrum, normalised by the flux at 7050 Å, is shown in black in the regions used to calculated G and in grey elsewhere. The pair AV = 0.75 mag, and M2-type stellar spectrum (green line) represents the best fit to the object. For comparison, spectra of M-1 and M-3 type stars are shown in blue and orange, respectively. The bottom panel shows the residuals of the comparison between the GMOS object and the M2-type stellar spectrum.
Current usage metrics show cumulative count of Article Views (full-text article views including HTML views, PDF and ePub downloads, according to the available data) and Abstracts Views on Vision4Press platform.
Data correspond to usage on the plateform after 2015. The current usage metrics is available 48-96 hours after online publication and is updated daily on week days.
Initial download of the metrics may take a while.