Fig. 4
Download original image
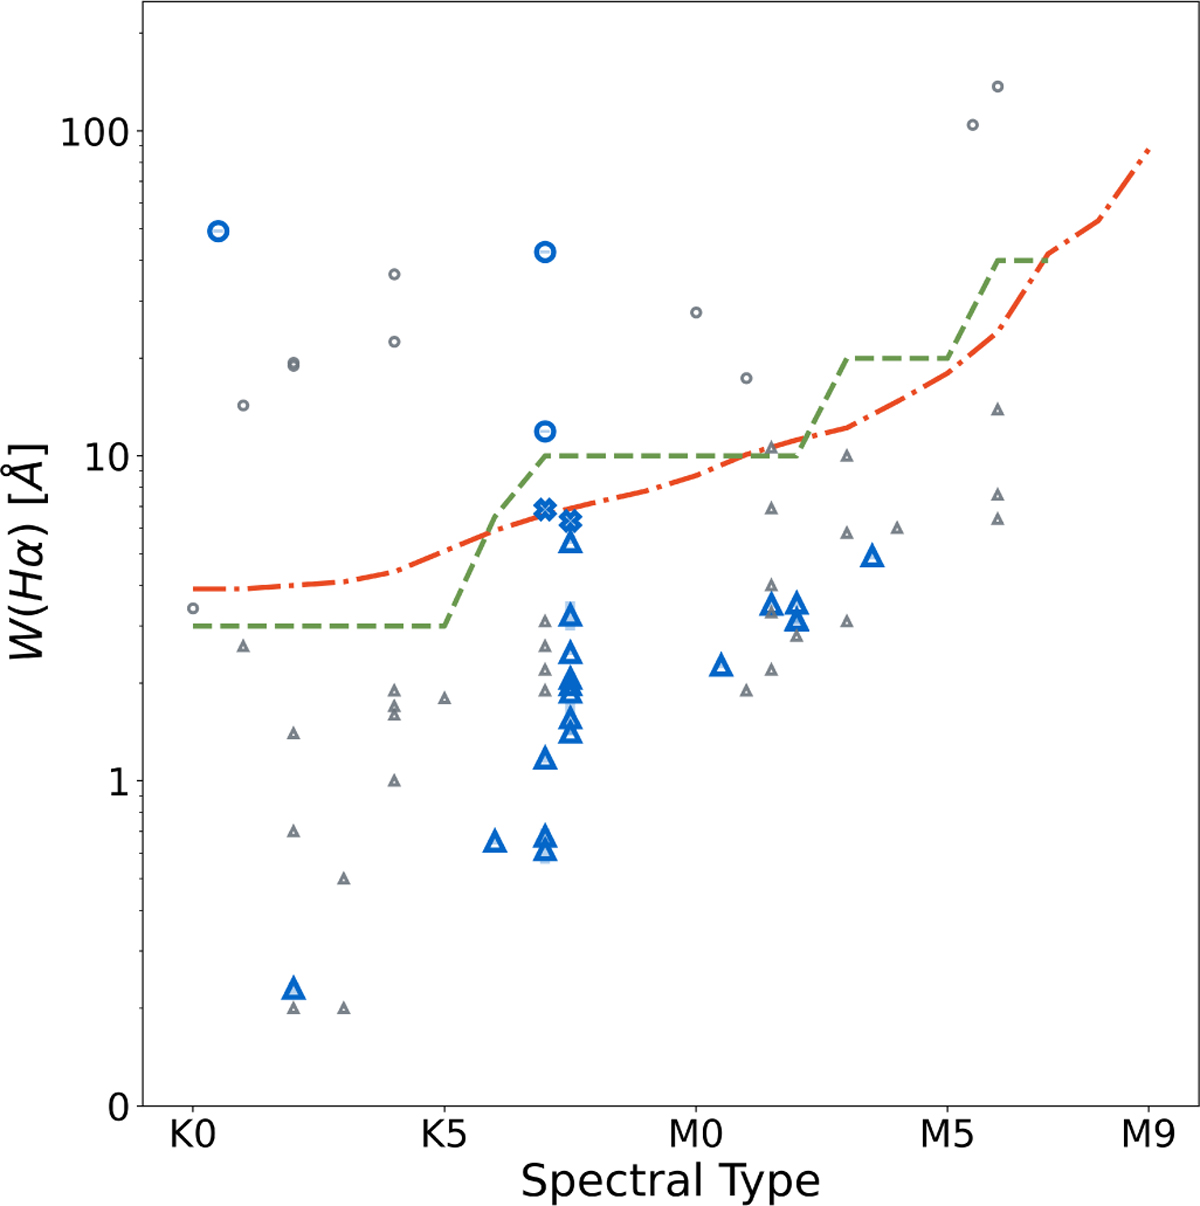
Thresholds defining the CTT classification following White & Basri green dashed line (2003) and Barrado y Navascués & Martín orange dash-dotted line (2003). Blue symbols represent our sample; grey symbols are data from Fernandes et al. (2015). These criteria were used to classify the CTTs (indicated by circles), WTTs (triangles), and possible WTTs (crosses).
Current usage metrics show cumulative count of Article Views (full-text article views including HTML views, PDF and ePub downloads, according to the available data) and Abstracts Views on Vision4Press platform.
Data correspond to usage on the plateform after 2015. The current usage metrics is available 48-96 hours after online publication and is updated daily on week days.
Initial download of the metrics may take a while.