Fig. 5
Download original image
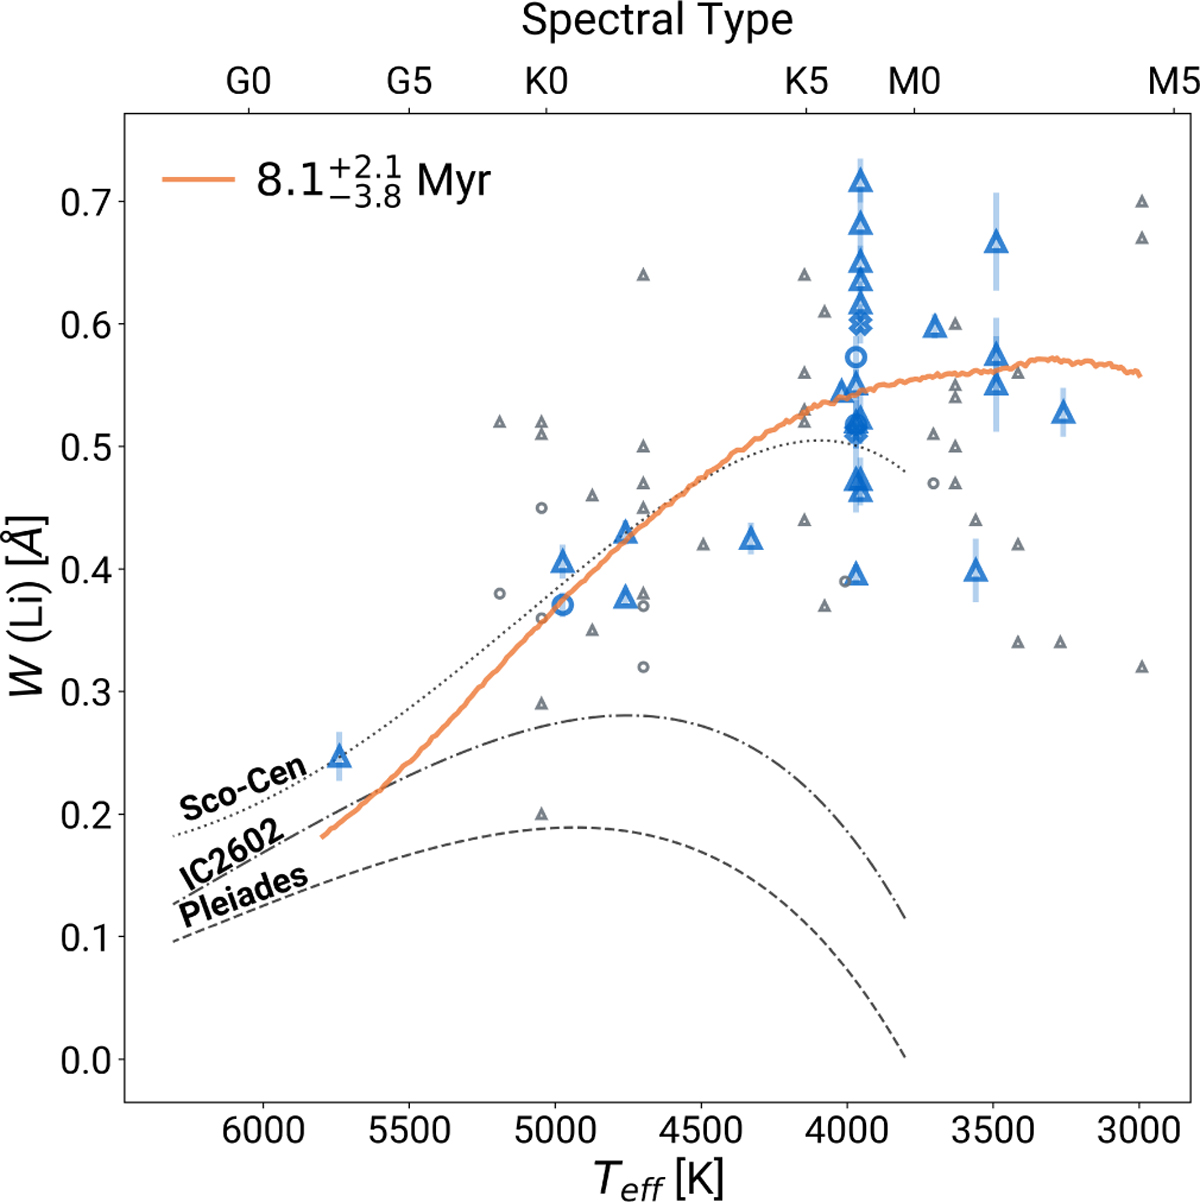
W(Li) from the 6708 Å line vs Teff and spectral type. Symbols and colours are the same as in Fig. 4. Grey lines are polynomial fits for observed data in other young clusters: Sco-Cen (10–16 Myr), IC2602 (45 Myr), and Pleiades (125 Myr) – see Pecaut & Mamajek (2016) and references therein. The orange line represents the expected curve for a population of ![]() Myr, as calculated by EAGLES v2.
Myr, as calculated by EAGLES v2.
Current usage metrics show cumulative count of Article Views (full-text article views including HTML views, PDF and ePub downloads, according to the available data) and Abstracts Views on Vision4Press platform.
Data correspond to usage on the plateform after 2015. The current usage metrics is available 48-96 hours after online publication and is updated daily on week days.
Initial download of the metrics may take a while.