Fig. 6
Download original image
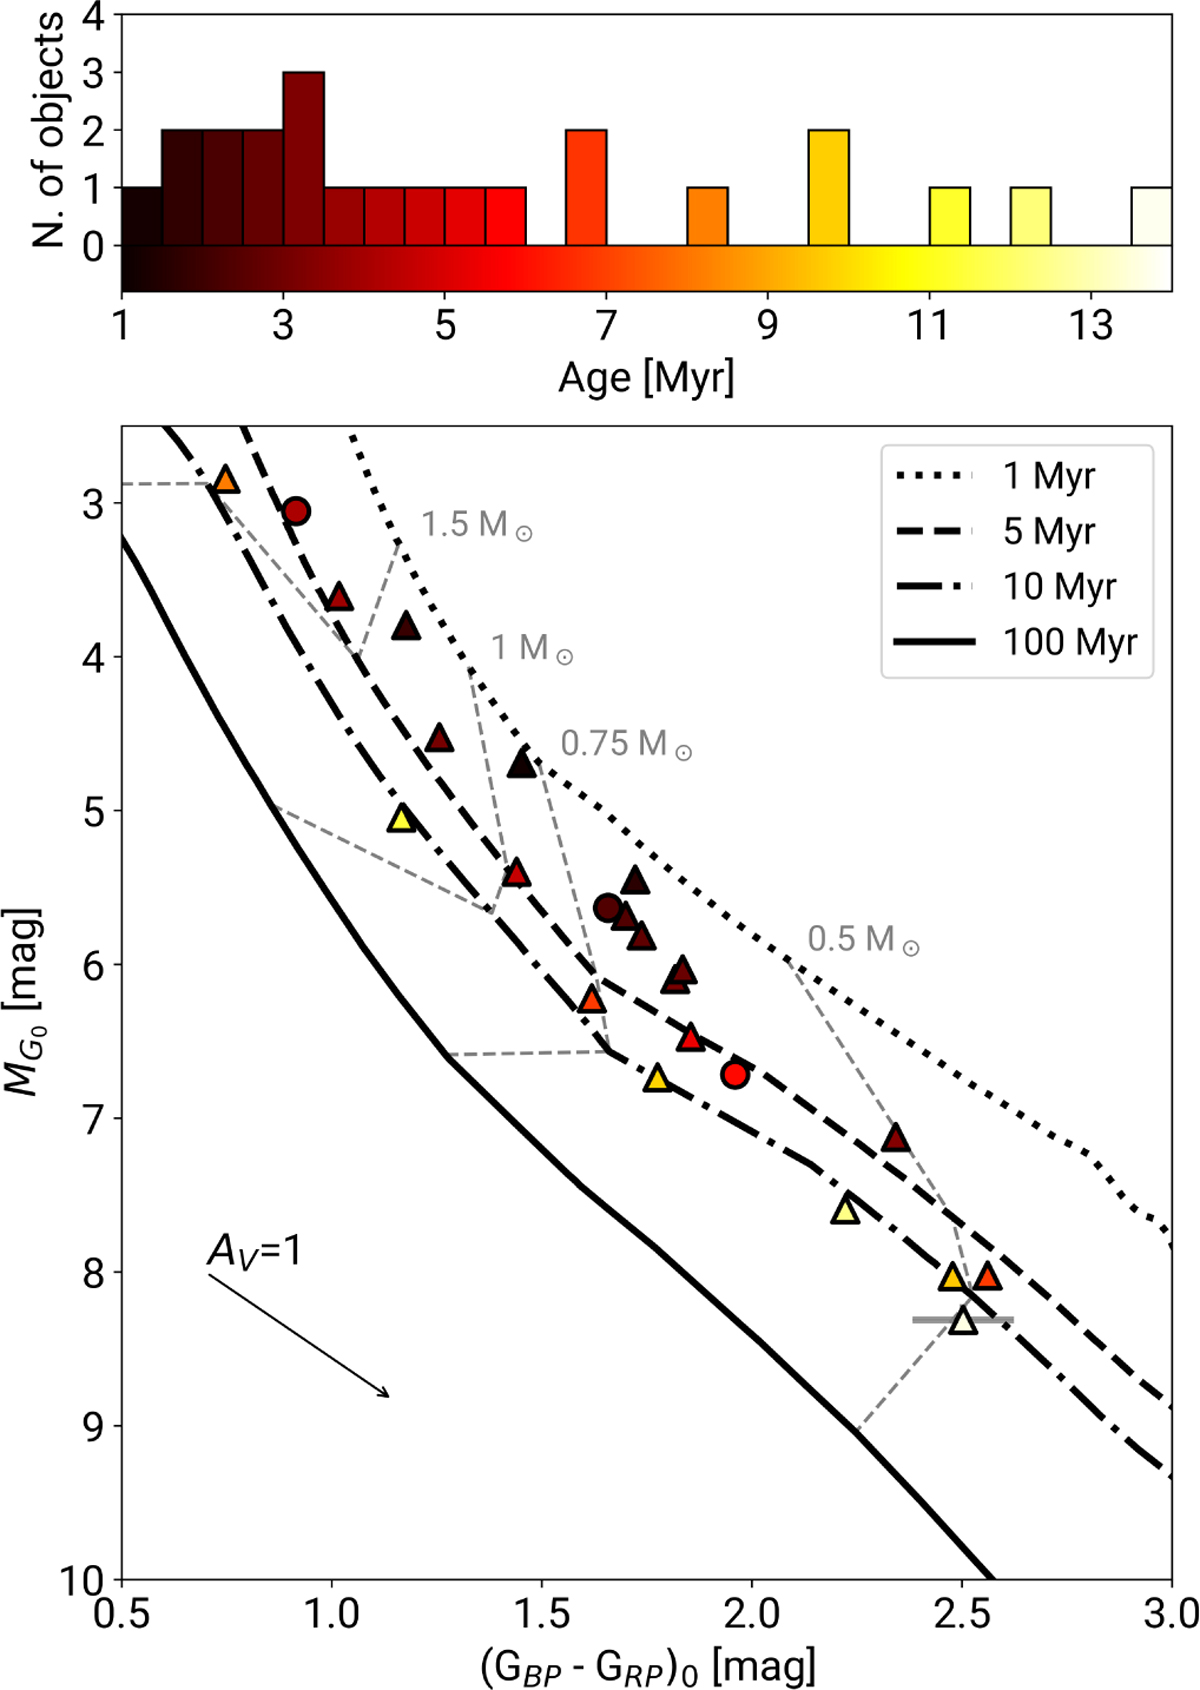
Top panel: histogram of ages estimated for our sample. Bottom: extinction-corrected CMD. The isochrones from PARSEC for 1, 5, 10, and 100 Myr are shown in thick black lines for reference. Thin dotted grey lines connect the points with the same mass in each isochrone ranging from 0.5 M⊙ to 1.5 M⊙. In both panels, colour is used to indicate individual ages.
Current usage metrics show cumulative count of Article Views (full-text article views including HTML views, PDF and ePub downloads, according to the available data) and Abstracts Views on Vision4Press platform.
Data correspond to usage on the plateform after 2015. The current usage metrics is available 48-96 hours after online publication and is updated daily on week days.
Initial download of the metrics may take a while.