Open Access
Fig. C.1
Download original image
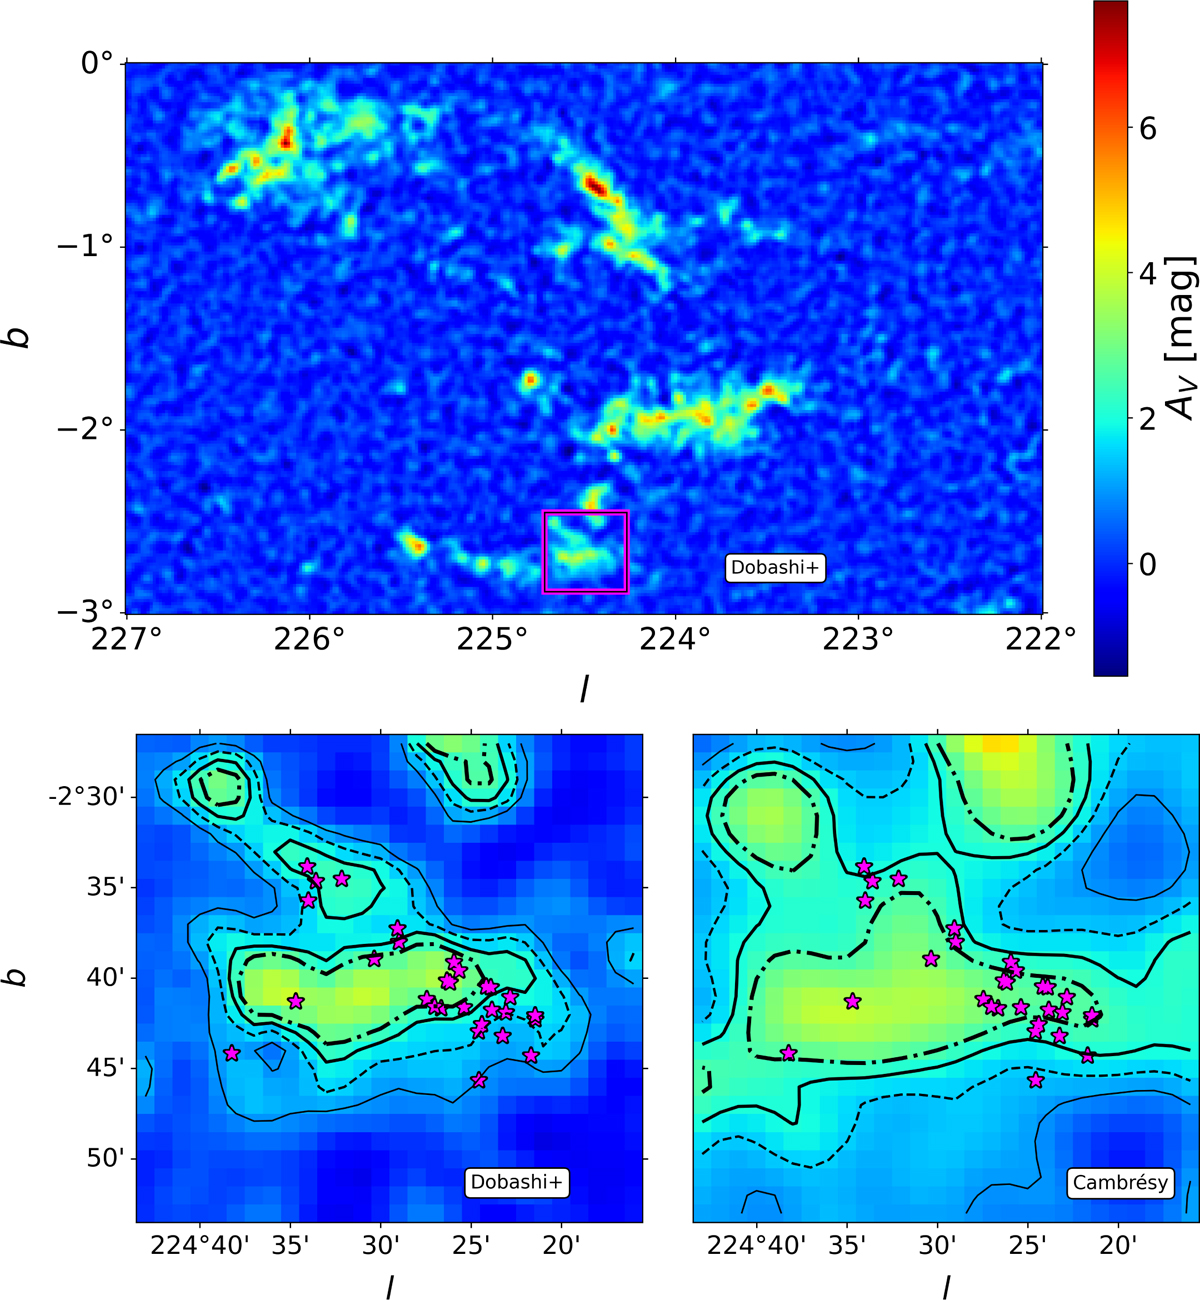
2D extinction maps from Dobashi+ and Cambrésy. The top panel indicates the CMa region while the bottom panel shows a zoom in the region highlighted in magenta in the top panel. Magenta star symbols indicate the position of all 29 TT stars studied in this work.
Current usage metrics show cumulative count of Article Views (full-text article views including HTML views, PDF and ePub downloads, according to the available data) and Abstracts Views on Vision4Press platform.
Data correspond to usage on the plateform after 2015. The current usage metrics is available 48-96 hours after online publication and is updated daily on week days.
Initial download of the metrics may take a while.