Fig. 11
Download original image
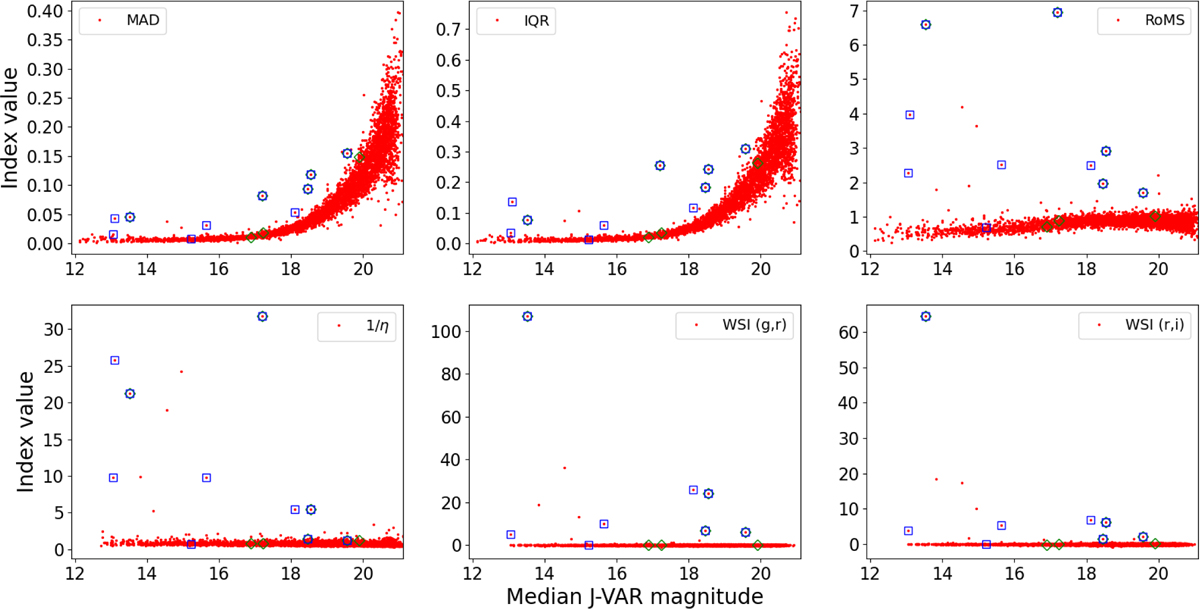
Example of variability indices calculated from light curves of field 00056 in the rSDSS filter. Known variables within the VSX database are indicated by blue squares, while those from Gaia are shown by green diamonds. The indices were calculated under the requirement that valid points have a photometric quality flag equal to zero.
Current usage metrics show cumulative count of Article Views (full-text article views including HTML views, PDF and ePub downloads, according to the available data) and Abstracts Views on Vision4Press platform.
Data correspond to usage on the plateform after 2015. The current usage metrics is available 48-96 hours after online publication and is updated daily on week days.
Initial download of the metrics may take a while.