Fig. 4
Download original image
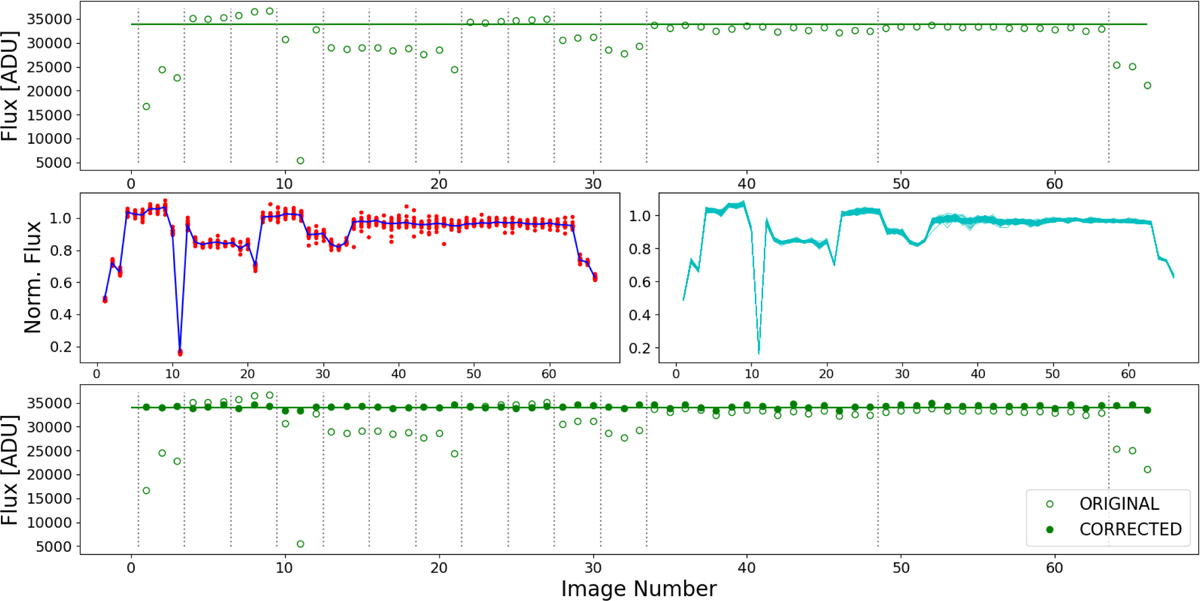
Visualisation of our light-curve correction and calibration procedure. For clarity, all light curves are plotted as consecutive points and not according to their actual time stamps. Top panel: extracted raw light curve of a target object (green open circles) in the gSDSS filter. The star used in this example is JVAR 113038.70+241022.56 (J-PLUS ID: 84850-294) from the field 00366. The vertical dotted grey lines indicate the different epochs of observation; the two wider blocks correspond to HFO. The horizontal solid green line corresponds to the reference J-PLUS flux for this object. Middle left panel: ensemble of comparison stars selected for this target (red points). Their light curves have been normalised by their respective J-PLUS reference fluxes. The solid blue line is the master correction curve obtained. Middle right panel: family of the 500 correction curves obtained from a bootstrap process, used to assign errors on the master correction curve. Bottom panel: raw light curve (open circles) and final light curve (filled circles) obtained after applying the master correction curve.
Current usage metrics show cumulative count of Article Views (full-text article views including HTML views, PDF and ePub downloads, according to the available data) and Abstracts Views on Vision4Press platform.
Data correspond to usage on the plateform after 2015. The current usage metrics is available 48-96 hours after online publication and is updated daily on week days.
Initial download of the metrics may take a while.