Fig. 6
Download original image
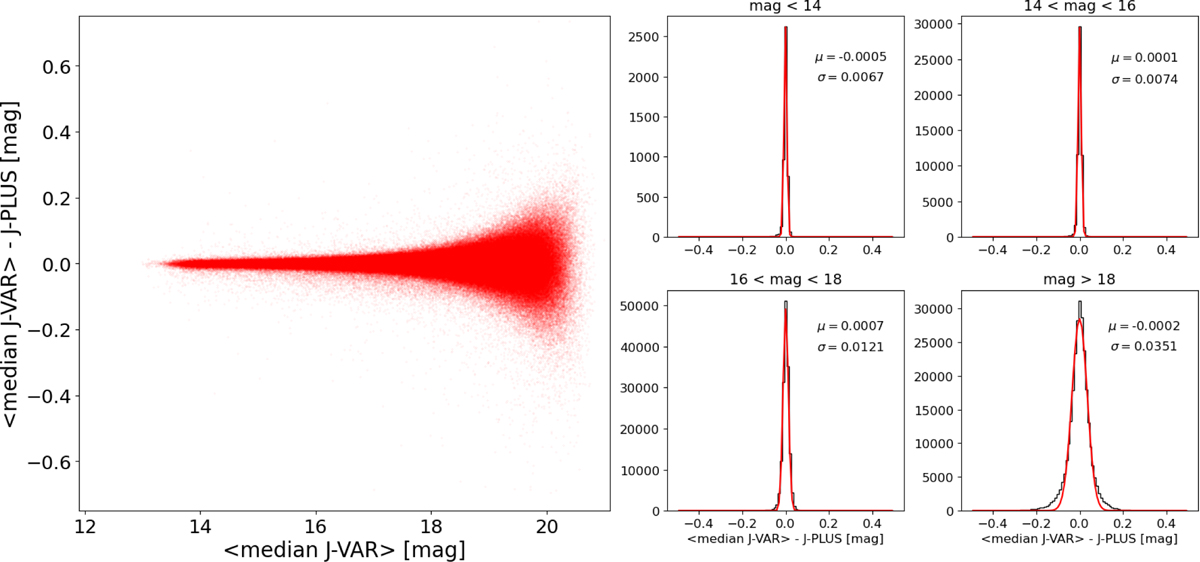
Photometric calibration of J-VAR DR1 on J-PLUS system. Shown in this plot are the results for the rSDSS filter. Left panel: difference between the median magnitude of each J-VAR light curve and the corresponding J-PLUS magnitude. Right panels: gaussian fits to the distribution of J-VAR minus J-PLUS values for different magnitude bins, identified at the top of each panel. We also provide the mean, μ, and the standard deviation, σ, of the fitted Gaussians.
Current usage metrics show cumulative count of Article Views (full-text article views including HTML views, PDF and ePub downloads, according to the available data) and Abstracts Views on Vision4Press platform.
Data correspond to usage on the plateform after 2015. The current usage metrics is available 48-96 hours after online publication and is updated daily on week days.
Initial download of the metrics may take a while.