Open Access
Fig. 1
Download original image
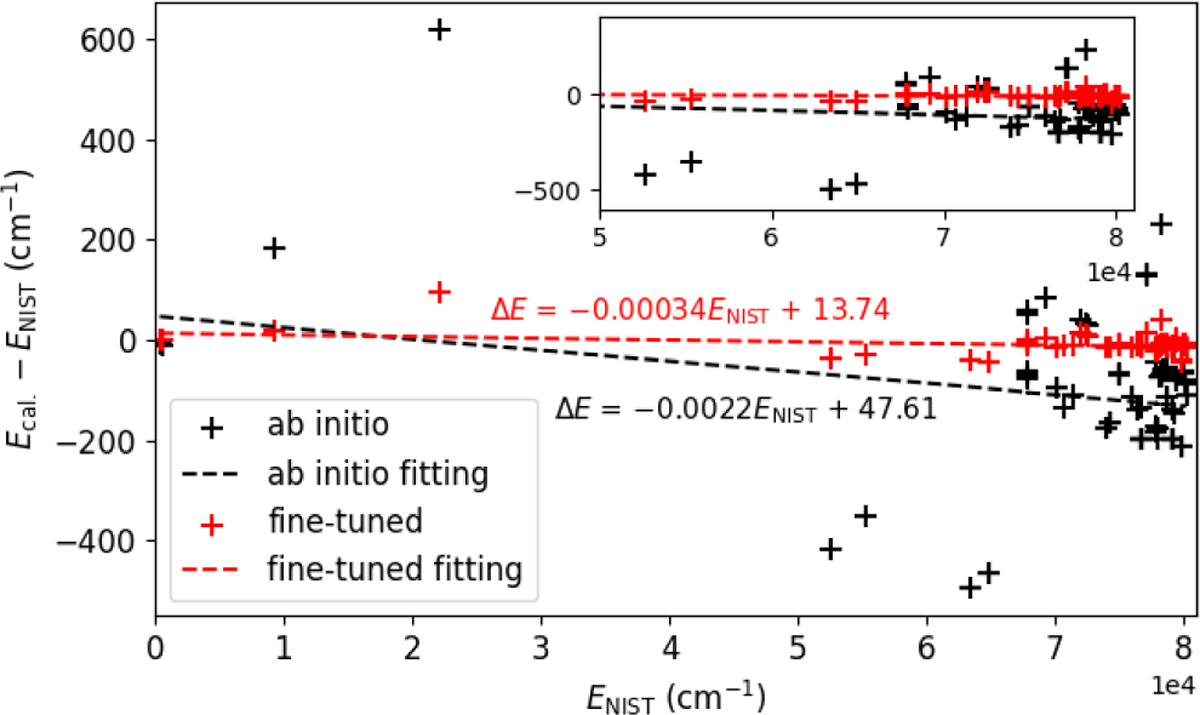
Energy differences as a function of excitation energies provided by NIST ASD. The dashed black and red lines are the linear fit to the data from ab initio (black plus) and fine-tuning (red plus) calculations, respectively. The inset in the upper right shows an enlarged view for ENIST > 5 × 104 cm−1.
Current usage metrics show cumulative count of Article Views (full-text article views including HTML views, PDF and ePub downloads, according to the available data) and Abstracts Views on Vision4Press platform.
Data correspond to usage on the plateform after 2015. The current usage metrics is available 48-96 hours after online publication and is updated daily on week days.
Initial download of the metrics may take a while.