Fig. 2
Download original image
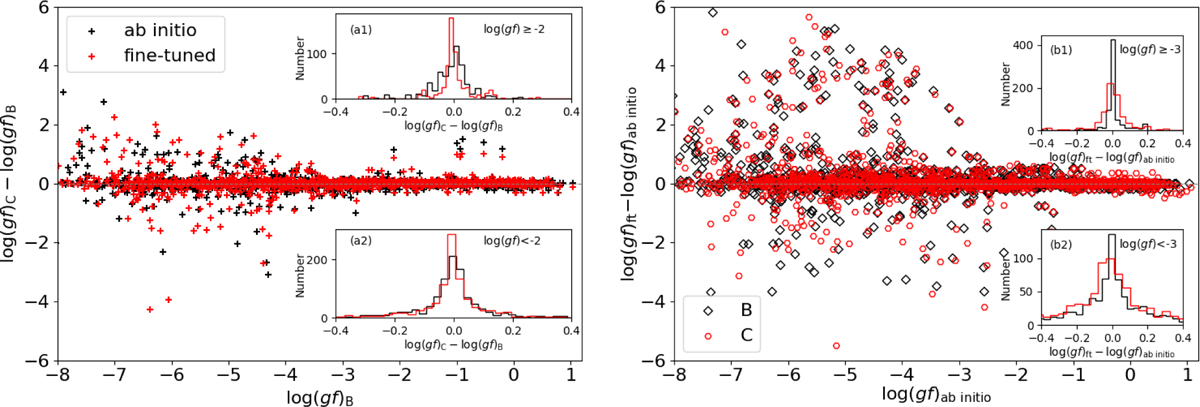
Left: comparison of log(gf) between Babushkin and Coulomb gauges for ab initio (black plus) and fine-tuned (red plus) results, respectively. Insets (a1) and (a2) show the histograms of the log(gf) differences for transitions with log(gf) ≥ −2 and log(gf) < −2, respectively. Right: comparison of log(gf) between ab initio and fine-tuned calculations for Babushkin (black diamond) and Coulomb gauges (red hexagon), respectively. Insets (b1) and (b2) show the histograms of the log(gf) differences for transitions with log(gf) ≥ −3 and log(gf) < −3, respectively.
Current usage metrics show cumulative count of Article Views (full-text article views including HTML views, PDF and ePub downloads, according to the available data) and Abstracts Views on Vision4Press platform.
Data correspond to usage on the plateform after 2015. The current usage metrics is available 48-96 hours after online publication and is updated daily on week days.
Initial download of the metrics may take a while.