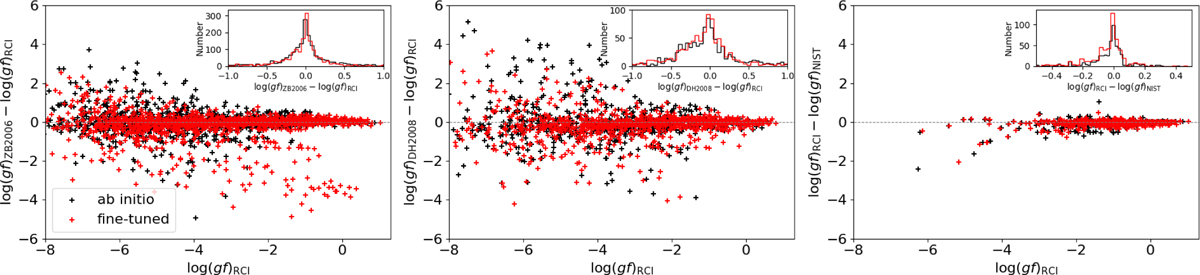
Fig. 3
Download original image
Comparison of log(gf) from the current study with those from previous works. Left: ZB2006 (Zatsarinny & Bartschat 2006). Middle: DH2008 (Deb & Hibbert 2008). Right: NIST ASD (Kramida et al. 2024). The data in NIST ASD were compiled from various sources, including Müller (1968); Beideck et al. (1994); Biémont et al. (1996, 1998); Zerne et al. (1997); Froese Fischer et al. (2006) and Zatsarinny & Bartschat (2006). Babushkin results from present ab initio (black plus) and fine-tuned (red plus) RCI calculations are used in the comparison. The inset figures show the histograms of the distribution of the number of transitions for the differences in log(gf). Note that the y-axis range is consistent across all plots in Figures 2 and 3.
Current usage metrics show cumulative count of Article Views (full-text article views including HTML views, PDF and ePub downloads, according to the available data) and Abstracts Views on Vision4Press platform.
Data correspond to usage on the plateform after 2015. The current usage metrics is available 48-96 hours after online publication and is updated daily on week days.
Initial download of the metrics may take a while.