Fig. 4
Download original image
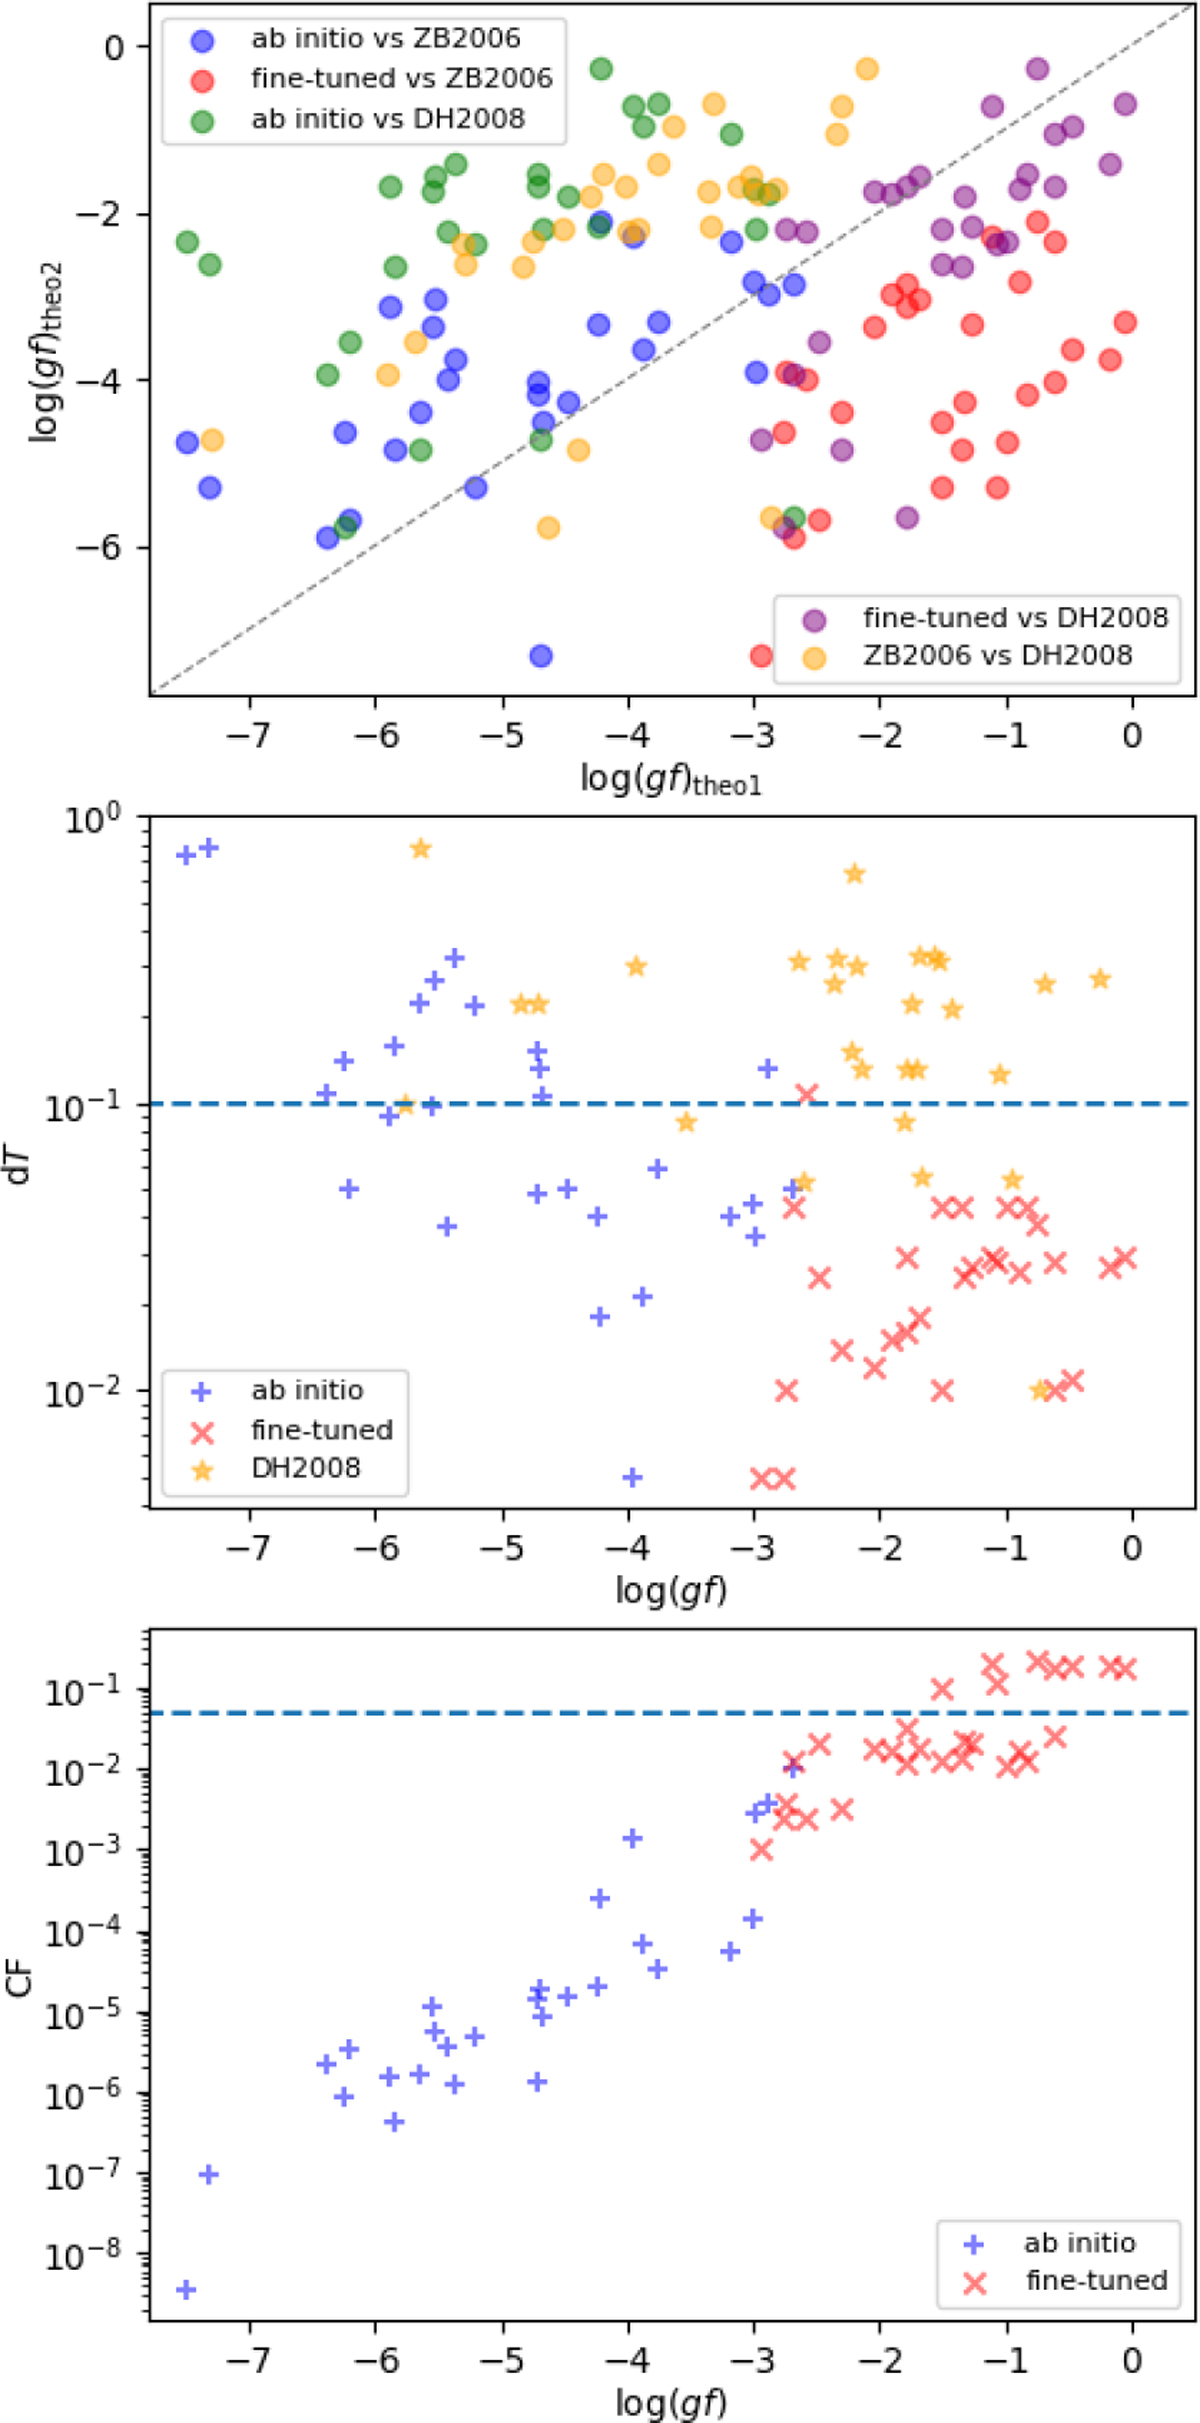
Upper panel: comparison of theoretical log(gf) values for transitions with log(gf)RCI > −3.0 and Δlog(gf) > 1.0 dex shown in the left and middle panels of Figure 3. Middle panel: scatter plot of dT values. Lower panel: scatter plot of CF values. The dashed lines in the middle panel and the lower panel represent dT = 0.1 and CF = 0.05, respectively. ZB2006: Zatsarinny & Bartschat (2006); DH2008: Deb & Hibbert (2008).
Current usage metrics show cumulative count of Article Views (full-text article views including HTML views, PDF and ePub downloads, according to the available data) and Abstracts Views on Vision4Press platform.
Data correspond to usage on the plateform after 2015. The current usage metrics is available 48-96 hours after online publication and is updated daily on week days.
Initial download of the metrics may take a while.