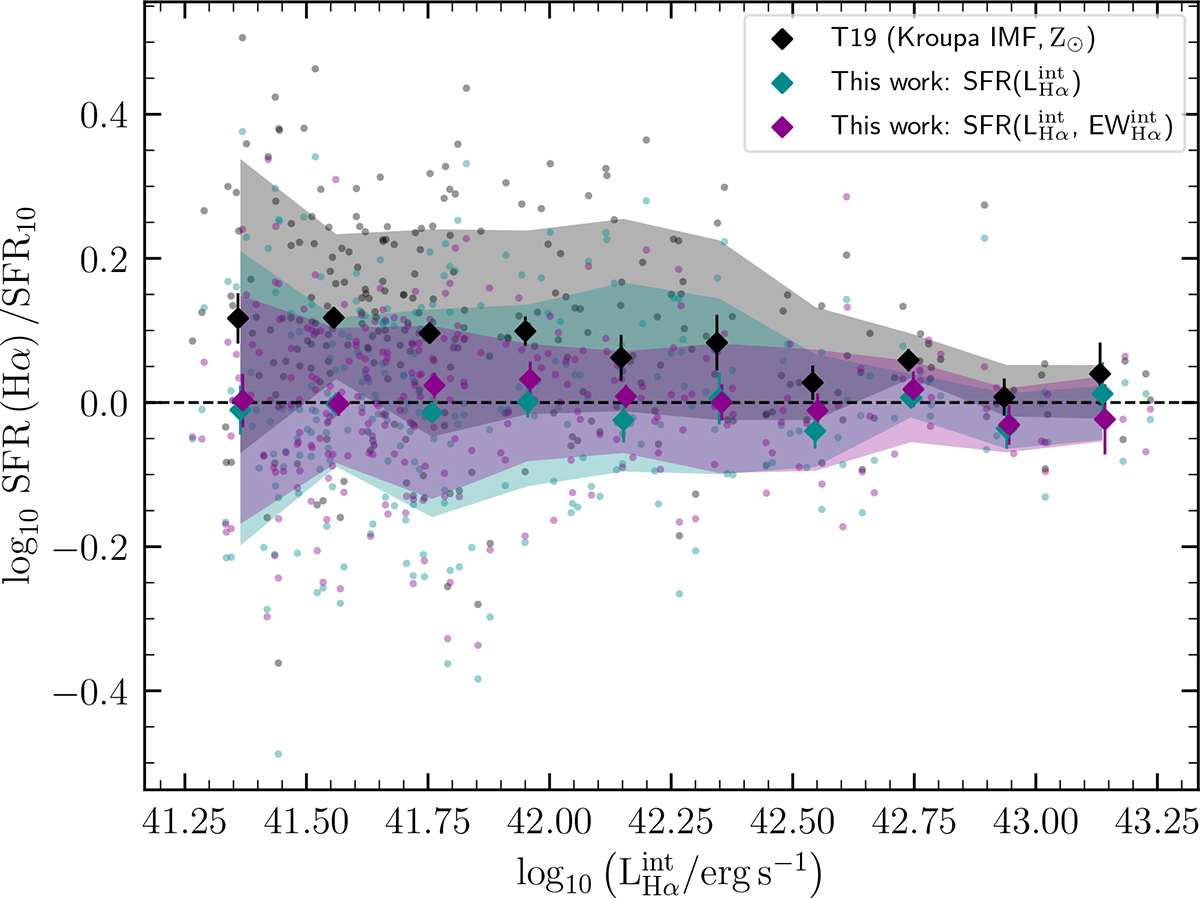
Fig. 3.
Download original image
Comparison of the SFR(Hα) calibrations as a function of the intrinsic Hα luminosity: T19 calibration (gray) and the new SFR(Hα) calibrations given in Eq. (2) (cyan) and Eq. (3) (magenta). The vertical axis represents the SFR bias factor (ΔSFR ≡ SFR(Hα)/SFR10; closer to logΔSFR = 0 is better). The diamonds show the running median, with the error bars indicating the standard error on the median. The shaded regions indicate the 68% (1σ) confidence interval.
Current usage metrics show cumulative count of Article Views (full-text article views including HTML views, PDF and ePub downloads, according to the available data) and Abstracts Views on Vision4Press platform.
Data correspond to usage on the plateform after 2015. The current usage metrics is available 48-96 hours after online publication and is updated daily on week days.
Initial download of the metrics may take a while.