Fig. 1
Download original image
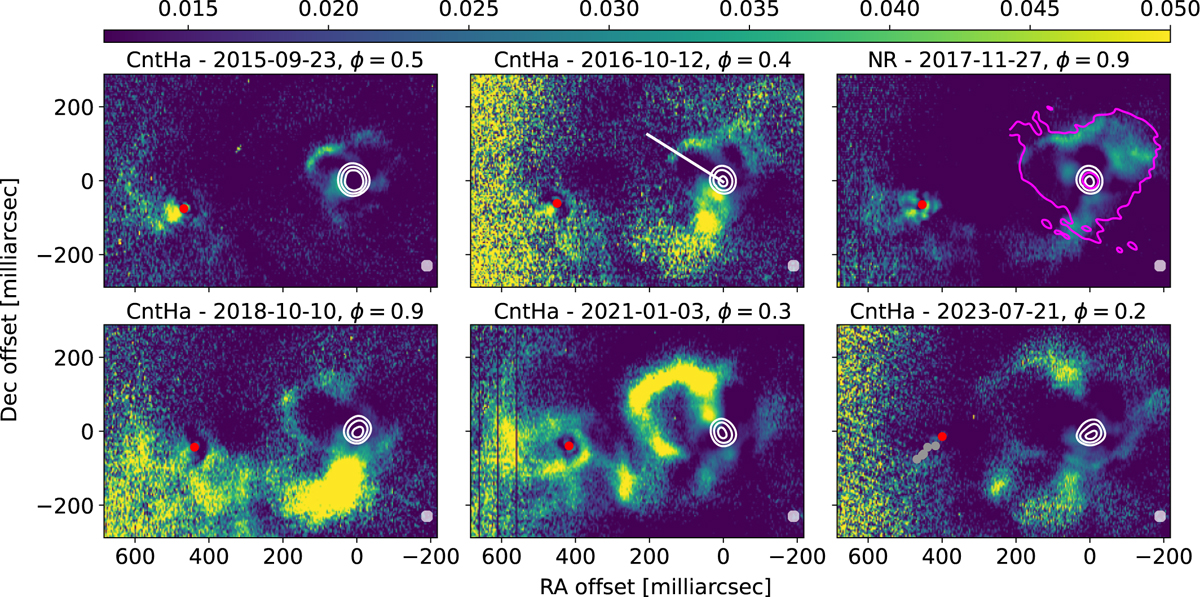
Images of the polarization degree (color map) toward Mira at different epochs in filters CntHa for all epochs except for 2017, which was observed with filter NR. The approximate pulsation phases (φ) of Mira A at the times of the observations are given above each panel. The white contours show the total intensity emission from Mira A at 20%, 40%, and 80% of the peak value. The red dots mark the position of the companion in the total intensity images, while the gray dots in the bottom right panel indicate the approximate position of the companion in previous epochs. The straight line used to determine the reference point on the NE lobe is shown in the upper middle panel. The 3σ contour of the SO JK = 88 - 77 emission in 2017 November (shown in Fig. 2) is marked by the magenta line in comparison to the polarized-light map at the same epoch. The gray ellipse in the bottom right corner of each panel indicates the full width at half maximum of the point spread function in the obtained images.
Current usage metrics show cumulative count of Article Views (full-text article views including HTML views, PDF and ePub downloads, according to the available data) and Abstracts Views on Vision4Press platform.
Data correspond to usage on the plateform after 2015. The current usage metrics is available 48-96 hours after online publication and is updated daily on week days.
Initial download of the metrics may take a while.