Open Access
Fig. B.1
Download original image
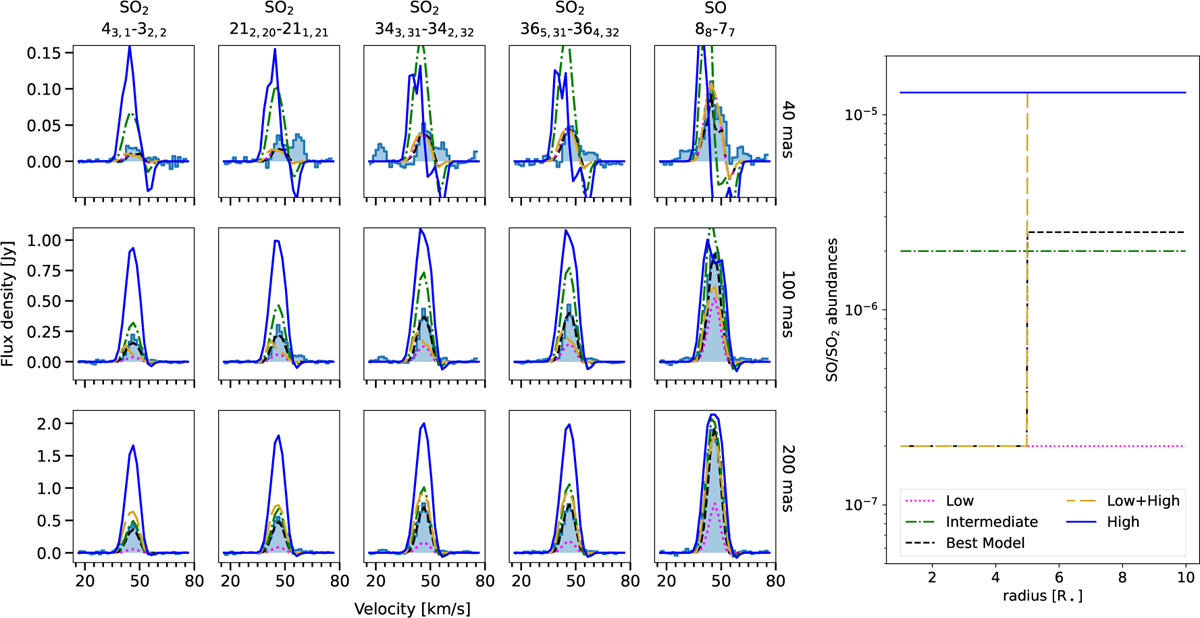
Predicted SO and SO2 line emission (left panels) considering different abundance profiles (right panel) and the density, temperature, and velocity distributions presented in Table 3. The line emission is shown with the same line color and style as the corresponding abundance profile.
Current usage metrics show cumulative count of Article Views (full-text article views including HTML views, PDF and ePub downloads, according to the available data) and Abstracts Views on Vision4Press platform.
Data correspond to usage on the plateform after 2015. The current usage metrics is available 48-96 hours after online publication and is updated daily on week days.
Initial download of the metrics may take a while.