Fig. 2
Download original image
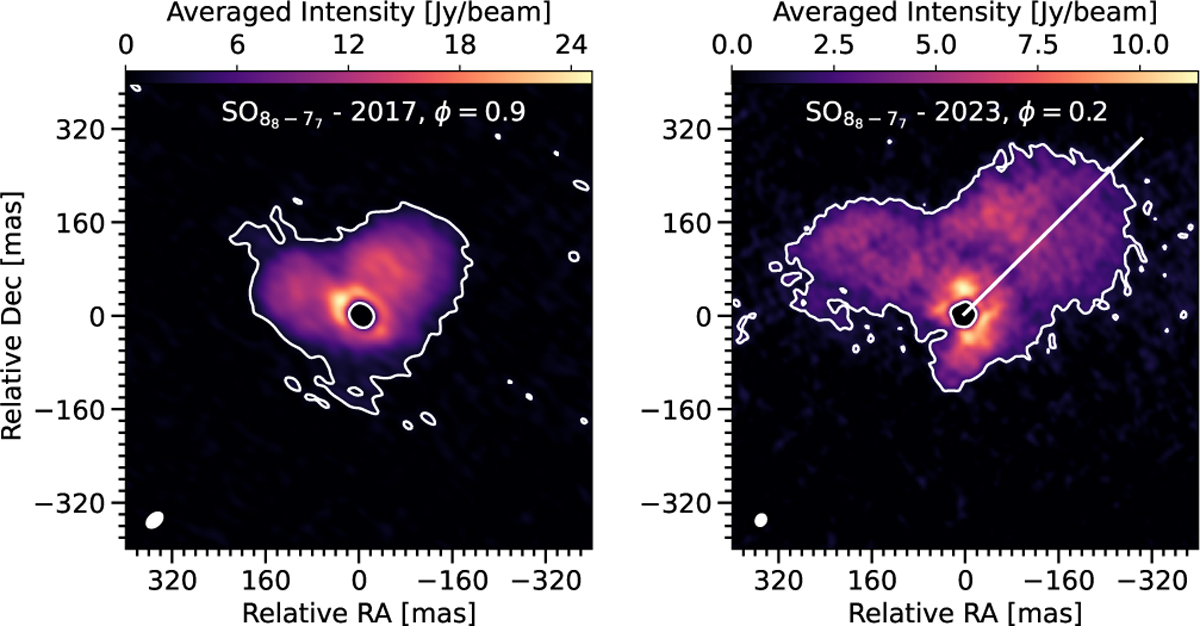
Moment-zero maps of the emission in the SO JK = 88–77 line observed in 2017 November 9 and 2023 July 6 and 14. The approximate pulsation phases (φ) of Mira A at the times of the observations are given at the top of each panel. The white contours mark where emission reaches three times the RMS noise level in each image. The straight white line in the right panel indicates the direction used to measure the size of the NW lobe in the two epochs.
Current usage metrics show cumulative count of Article Views (full-text article views including HTML views, PDF and ePub downloads, according to the available data) and Abstracts Views on Vision4Press platform.
Data correspond to usage on the plateform after 2015. The current usage metrics is available 48-96 hours after online publication and is updated daily on week days.
Initial download of the metrics may take a while.