Open Access
Fig. D.9
Download original image
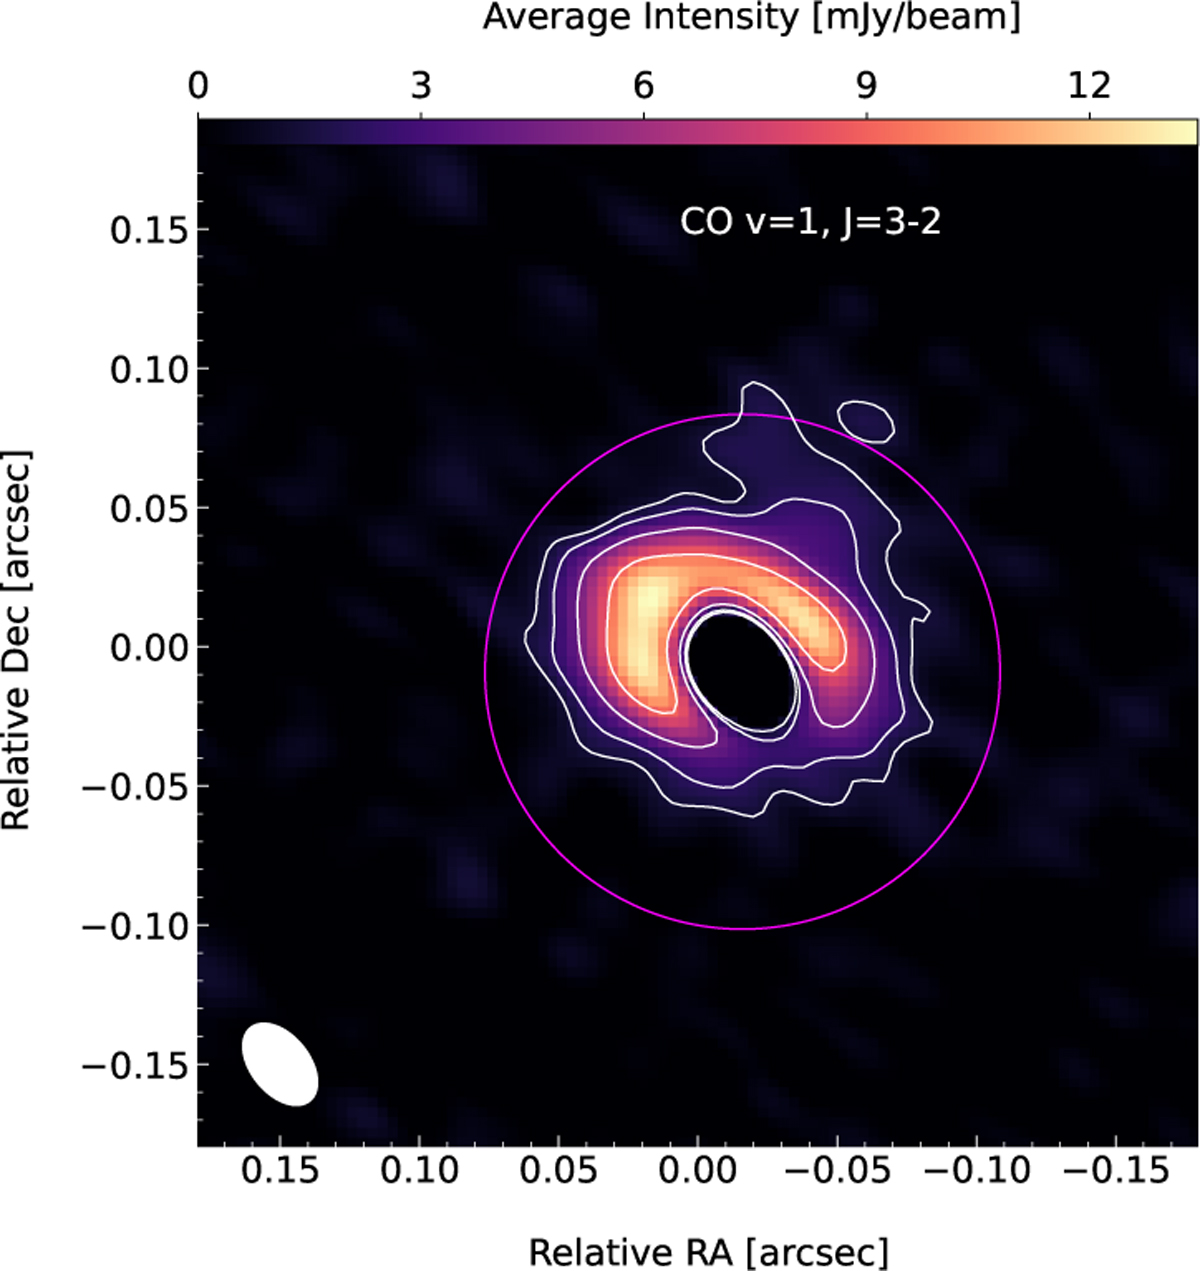
Observed map of CO v = 1, J = 3 - 2 emission. The white contours mark emission at 3, 5, 10, and 20 times the value of the root mean square noise in the image (0.45 mJy/beam). The magenta circle indicates the size of the inner high-density region in the radiative transfer models.
Current usage metrics show cumulative count of Article Views (full-text article views including HTML views, PDF and ePub downloads, according to the available data) and Abstracts Views on Vision4Press platform.
Data correspond to usage on the plateform after 2015. The current usage metrics is available 48-96 hours after online publication and is updated daily on week days.
Initial download of the metrics may take a while.