Open Access
Fig. 4
Download original image
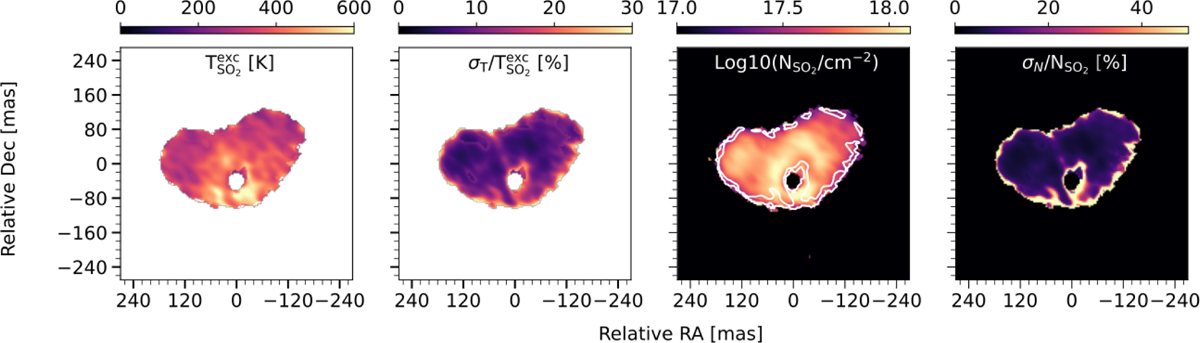
Results from the SO2 populations diagram. From left to right, the panels show the obtained maps of ![]() in Kelvin, the uncertainty on
in Kelvin, the uncertainty on ![]() in percentage, log10(NSO2 cm−2), and the uncertainty on NSO2 in percentage. The white contours indicate the 30% uncertainty level on NSO2.
in percentage, log10(NSO2 cm−2), and the uncertainty on NSO2 in percentage. The white contours indicate the 30% uncertainty level on NSO2.
Current usage metrics show cumulative count of Article Views (full-text article views including HTML views, PDF and ePub downloads, according to the available data) and Abstracts Views on Vision4Press platform.
Data correspond to usage on the plateform after 2015. The current usage metrics is available 48-96 hours after online publication and is updated daily on week days.
Initial download of the metrics may take a while.