Fig. 5
Download original image
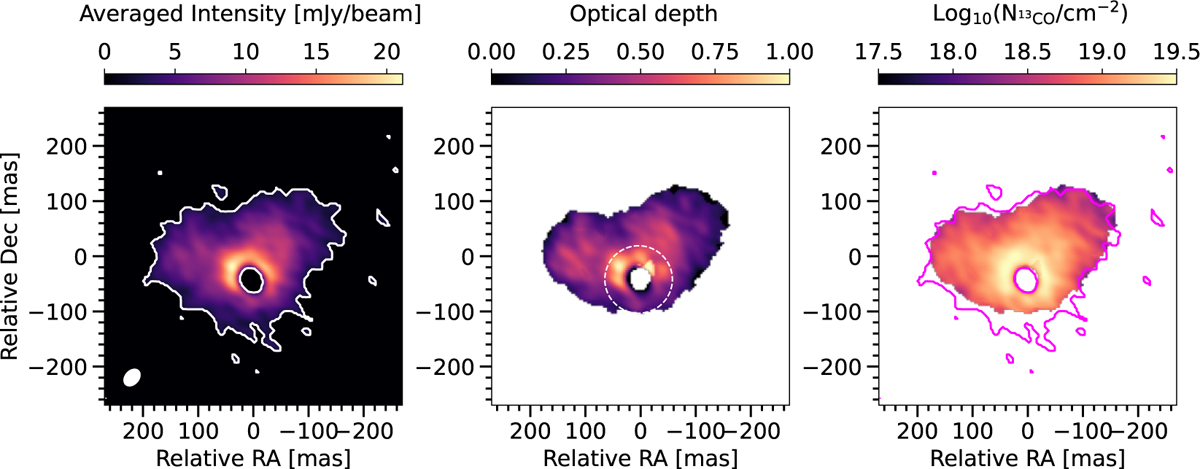
Observed emission (left) and inferred optical depth (middle) of the 13CO J = 3-2 line and corresponding calculated column density of 13CO (right) assuming optically thin emission and the same excitation temperature distribution derived for SO2. The dashed white circle in the middle panel marks the 60 mas radius inside of which the derived column densities are not reliable because of high optical depths. The white and magenta contours in the left and right panels, respectively, mark emission equal to three times the RMS noise level.
Current usage metrics show cumulative count of Article Views (full-text article views including HTML views, PDF and ePub downloads, according to the available data) and Abstracts Views on Vision4Press platform.
Data correspond to usage on the plateform after 2015. The current usage metrics is available 48-96 hours after online publication and is updated daily on week days.
Initial download of the metrics may take a while.