Fig. 9
Download original image
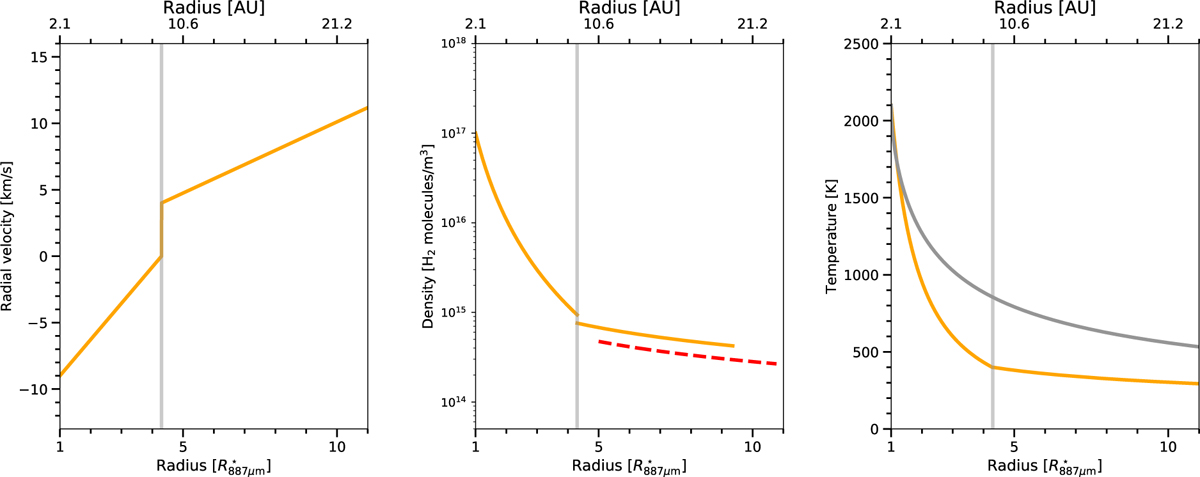
Physical parameters of the radiative transfer model (yellow line) summarized in Table 3 and with fits to the observations shown in Fig. 8. The dashed red line shows the lower density in the NE lobe. The gray curve in the temperature panel shows a gray atmosphere temperature profile. The vertical light gray lines mark Rtrans.
Current usage metrics show cumulative count of Article Views (full-text article views including HTML views, PDF and ePub downloads, according to the available data) and Abstracts Views on Vision4Press platform.
Data correspond to usage on the plateform after 2015. The current usage metrics is available 48-96 hours after online publication and is updated daily on week days.
Initial download of the metrics may take a while.