Open Access
Fig. 6.
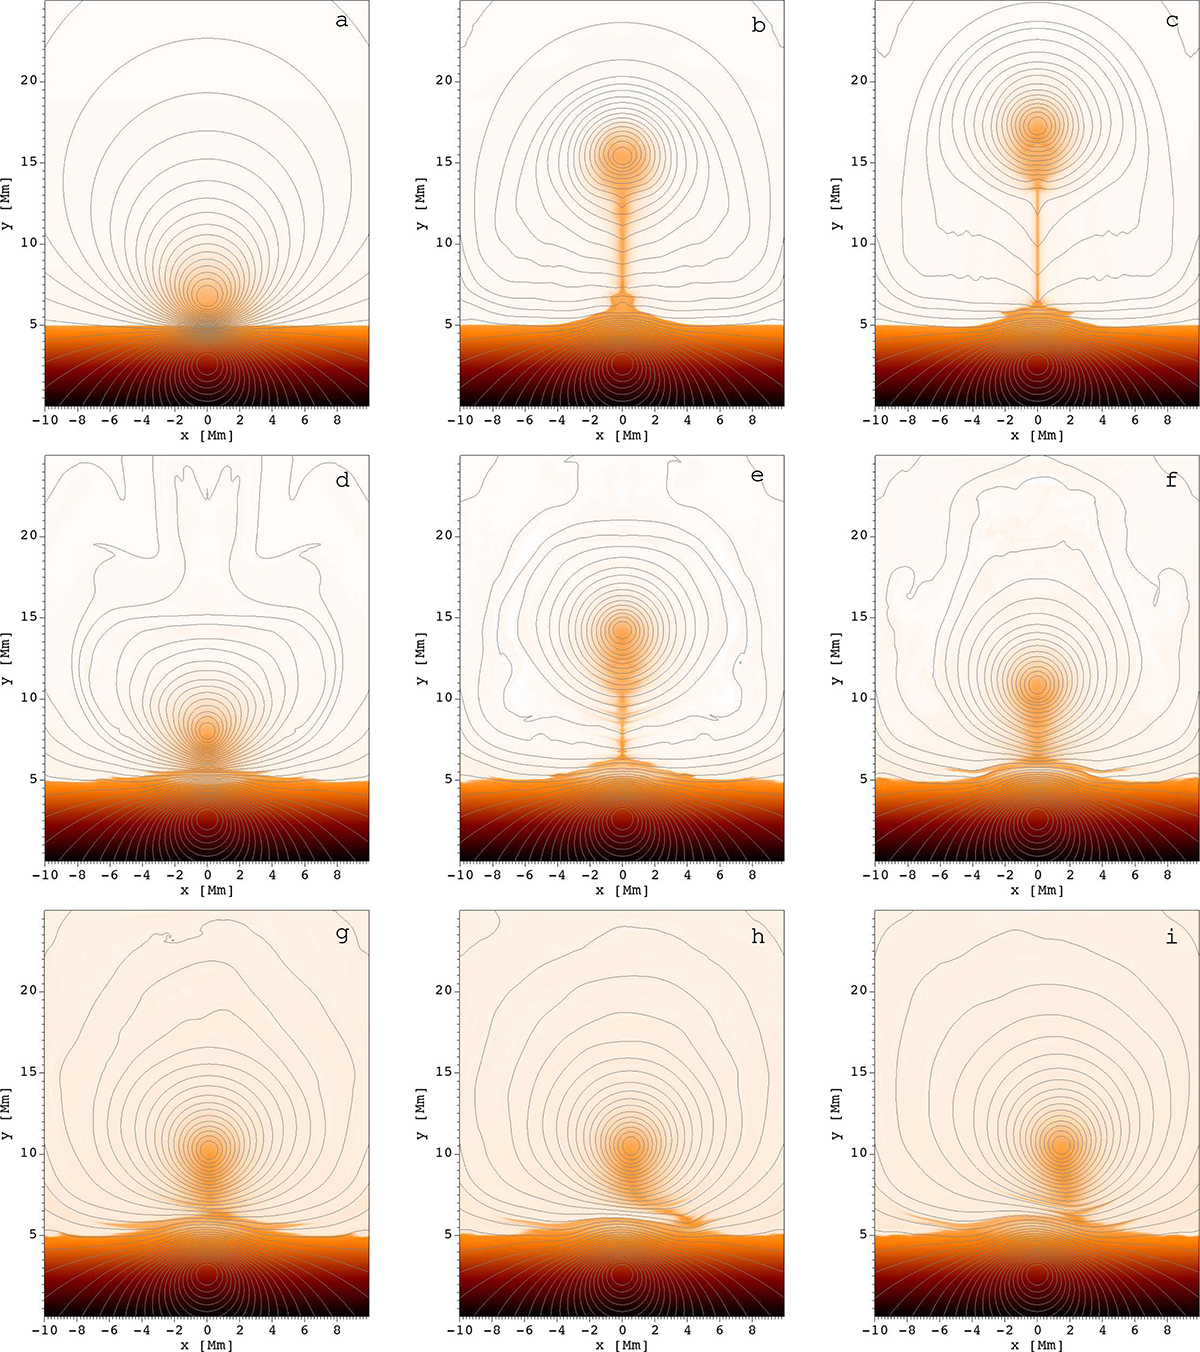
Download original image
Time evolution of the mass density and magnetic field lines, using the vector potential, represented by solid grey lines, for nine different times t = 0, 168, 280, 628, 897, 1121, 2240, 2800, and 3360 s (a–i, respectively) – the case with the increased electric current. The associated movie is available online.
Current usage metrics show cumulative count of Article Views (full-text article views including HTML views, PDF and ePub downloads, according to the available data) and Abstracts Views on Vision4Press platform.
Data correspond to usage on the plateform after 2015. The current usage metrics is available 48-96 hours after online publication and is updated daily on week days.
Initial download of the metrics may take a while.