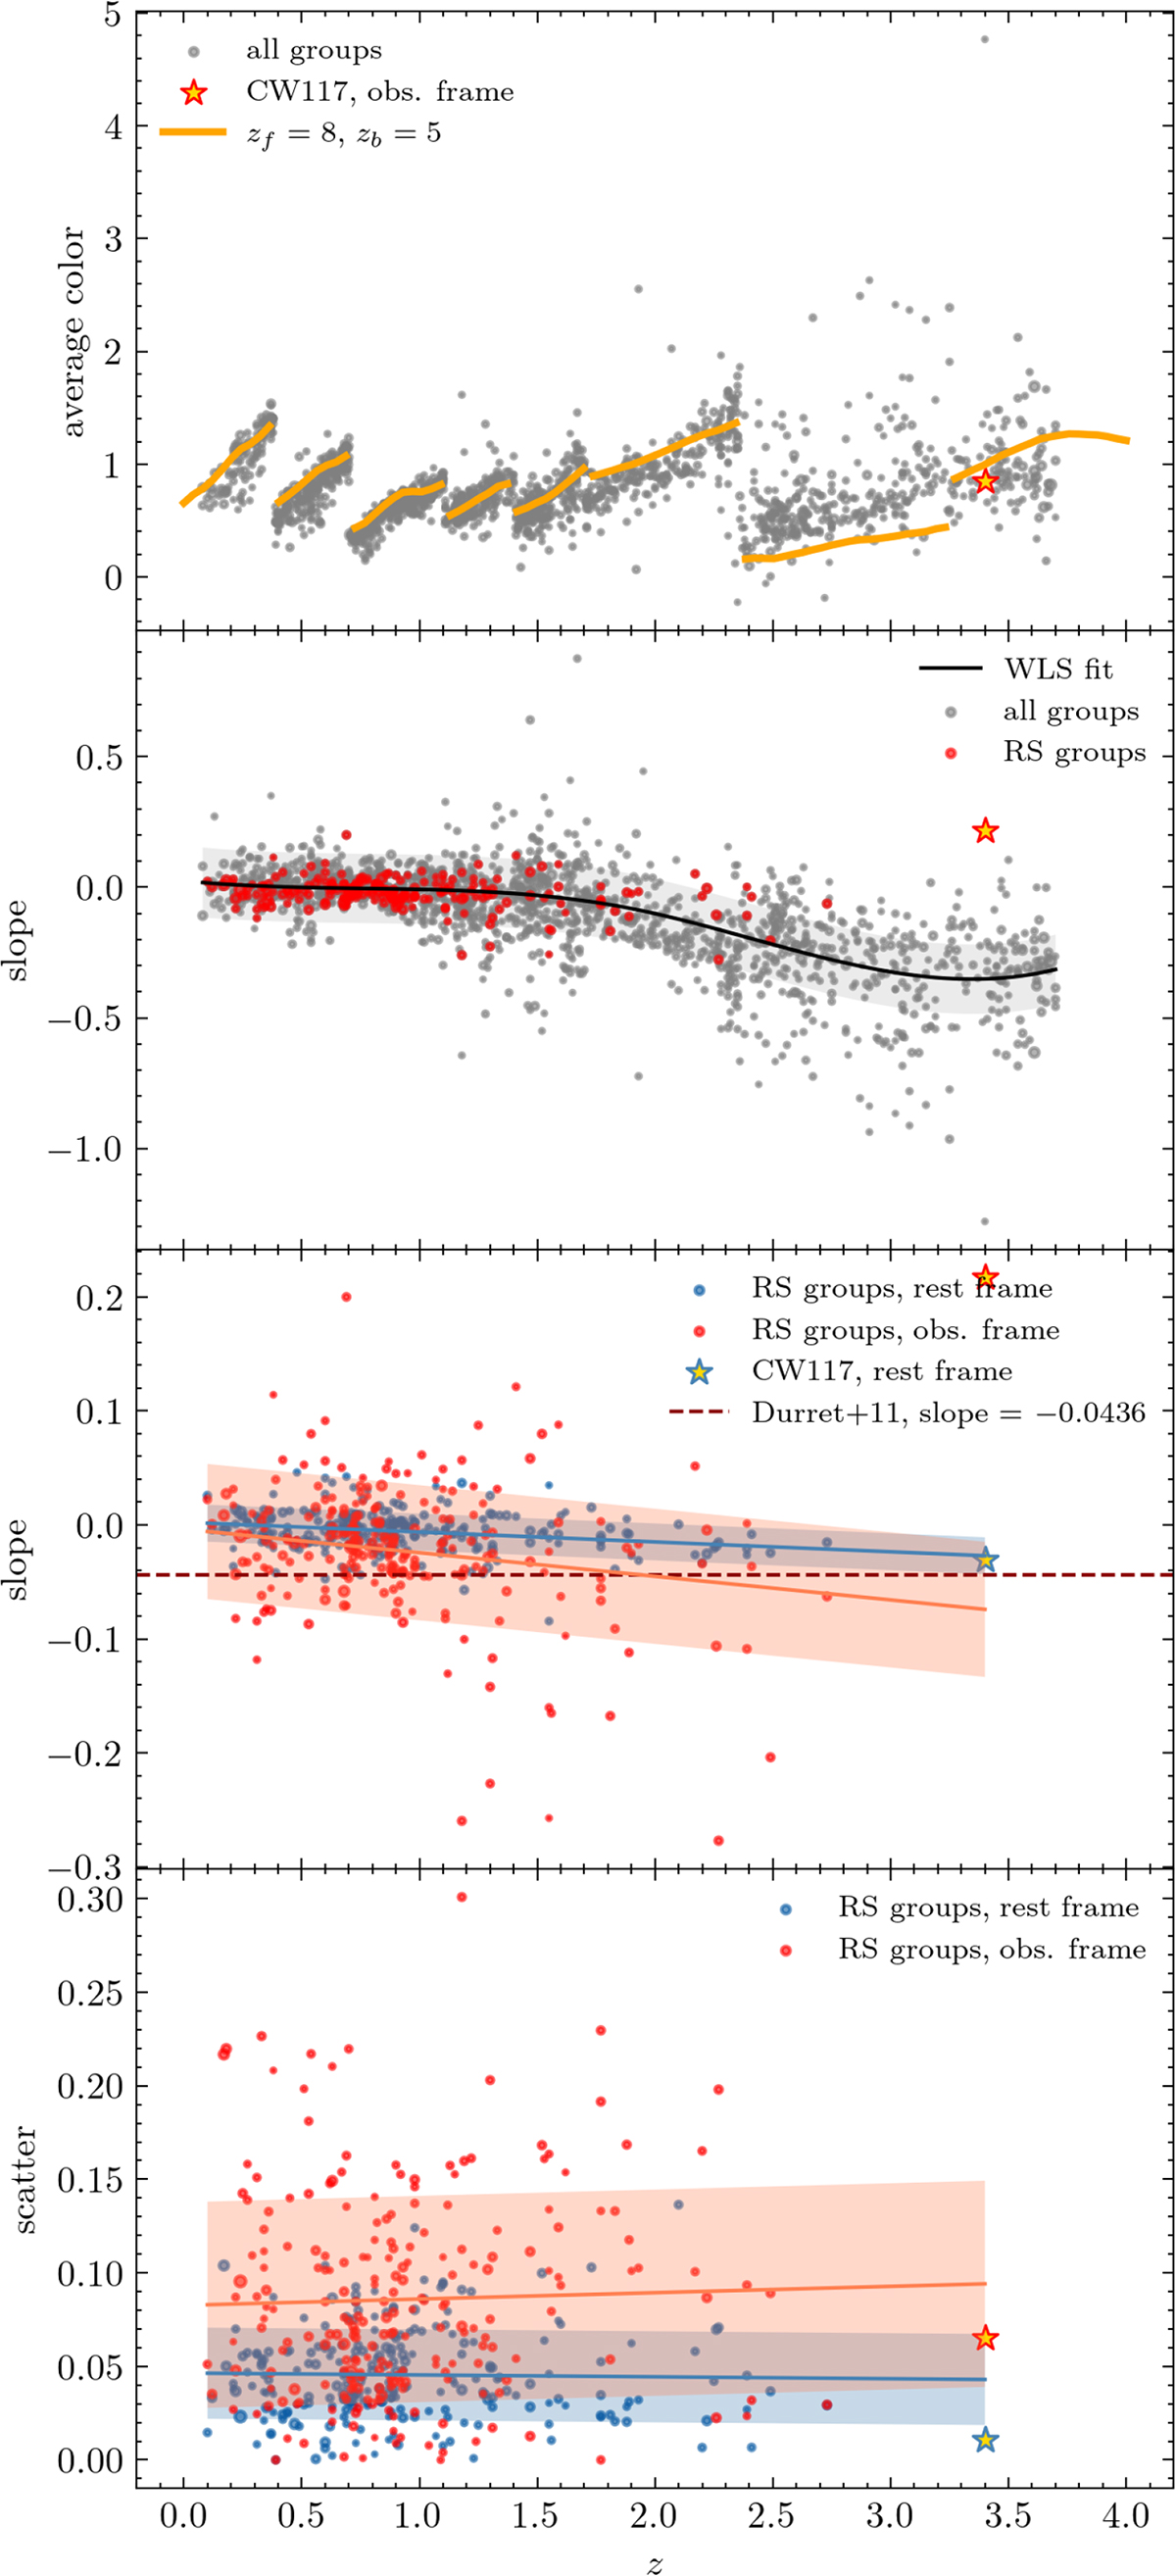
Fig. 11.
Download original image
Evolution with redshift of the main RS parameters for our group sample. From top to bottom: the first panel shows the average observed color as in Table 2, compared to our reference m★(z) model (orange lines). The star shows the CW117 detection, which has RS color compatible with that expected at that redshift for typical RS galaxies; the second panel shows the slope, with all groups in gray and those with RS in red; the third panel is a zoom on the slope of RS-groups only, with the parameters as retrieved using observer-frame (red points and orange fit line) and rest-frame magnitudes (blue point and fit line); the fourth panel shows the same but for the scatter of RS-groups. The yellow star shows the RS parameters of CW117, in the observer frame (red contours) and the rest frame (blue contours).
Current usage metrics show cumulative count of Article Views (full-text article views including HTML views, PDF and ePub downloads, according to the available data) and Abstracts Views on Vision4Press platform.
Data correspond to usage on the plateform after 2015. The current usage metrics is available 48-96 hours after online publication and is updated daily on week days.
Initial download of the metrics may take a while.