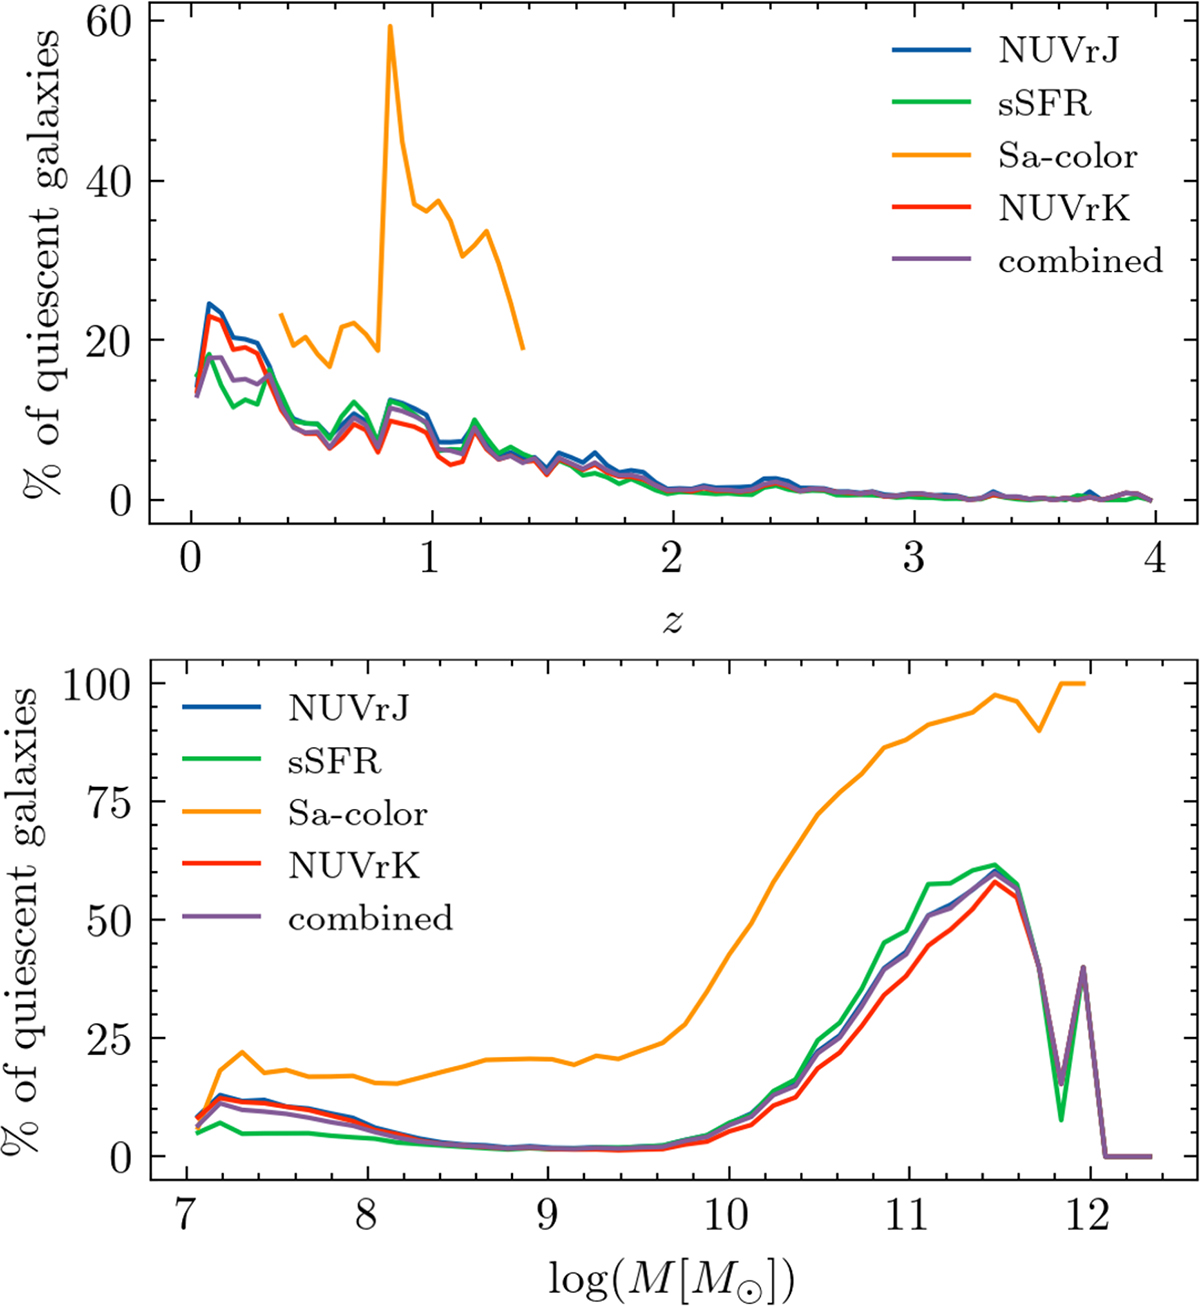
Fig. A.2.
Download original image
Variation in bins of redshift (upper panel) and galaxy stellar mass (lower panel) of the percentage of classified quiescent galaxies over the total, for the NUVrJ color-color cut (blue), the sSFR threshold (green), the Sa-color method (orange), and the NUVrK color-color cut (red). The purple line shows the final combined labeling we adopted for the training and testing sets.
Current usage metrics show cumulative count of Article Views (full-text article views including HTML views, PDF and ePub downloads, according to the available data) and Abstracts Views on Vision4Press platform.
Data correspond to usage on the plateform after 2015. The current usage metrics is available 48-96 hours after online publication and is updated daily on week days.
Initial download of the metrics may take a while.