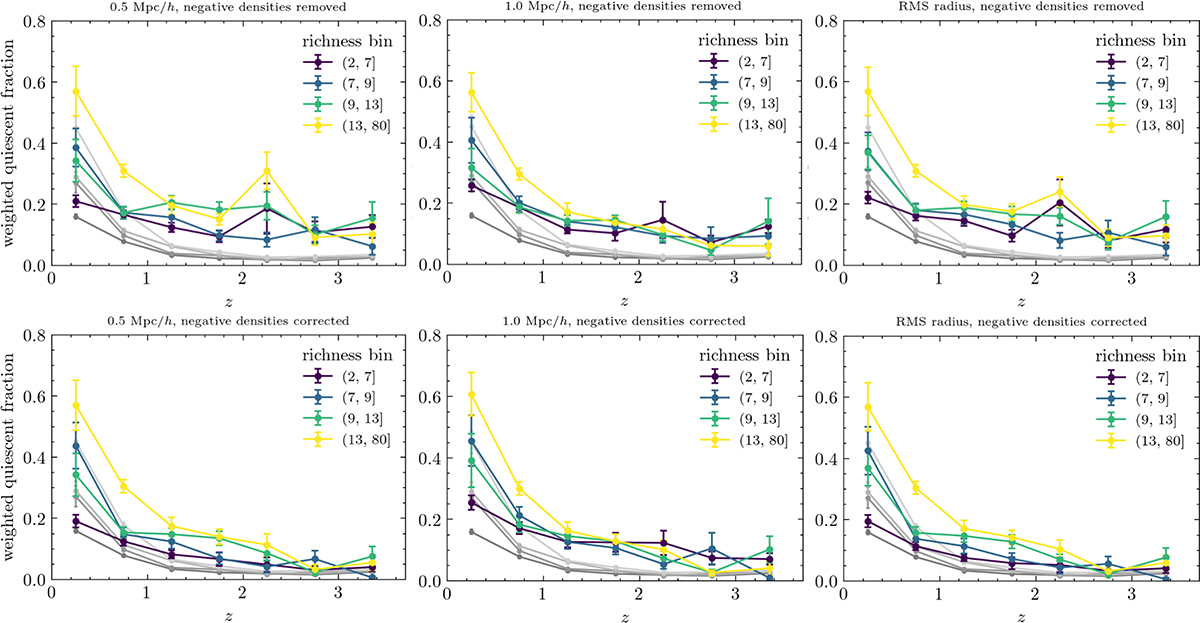
Fig. B.2.
Download original image
Purity-weighted quiescent fraction as a function of redshift for different richness bins, using fixed radii of 0.5 Mpc/h (left), 1.0 Mpc/h (middle), and the RMS radius (right). In the top panels, we discard all systems with negative densities, while in the bottom panels, we apply the corrections described in the text. Grayscale trend lines are reported using the pure-membership method in the same bins, for comparison. The RMS-based measurement with corrected negative densities is the method adopted in Sect. 4.2 and shown in Fig. 5.
Current usage metrics show cumulative count of Article Views (full-text article views including HTML views, PDF and ePub downloads, according to the available data) and Abstracts Views on Vision4Press platform.
Data correspond to usage on the plateform after 2015. The current usage metrics is available 48-96 hours after online publication and is updated daily on week days.
Initial download of the metrics may take a while.