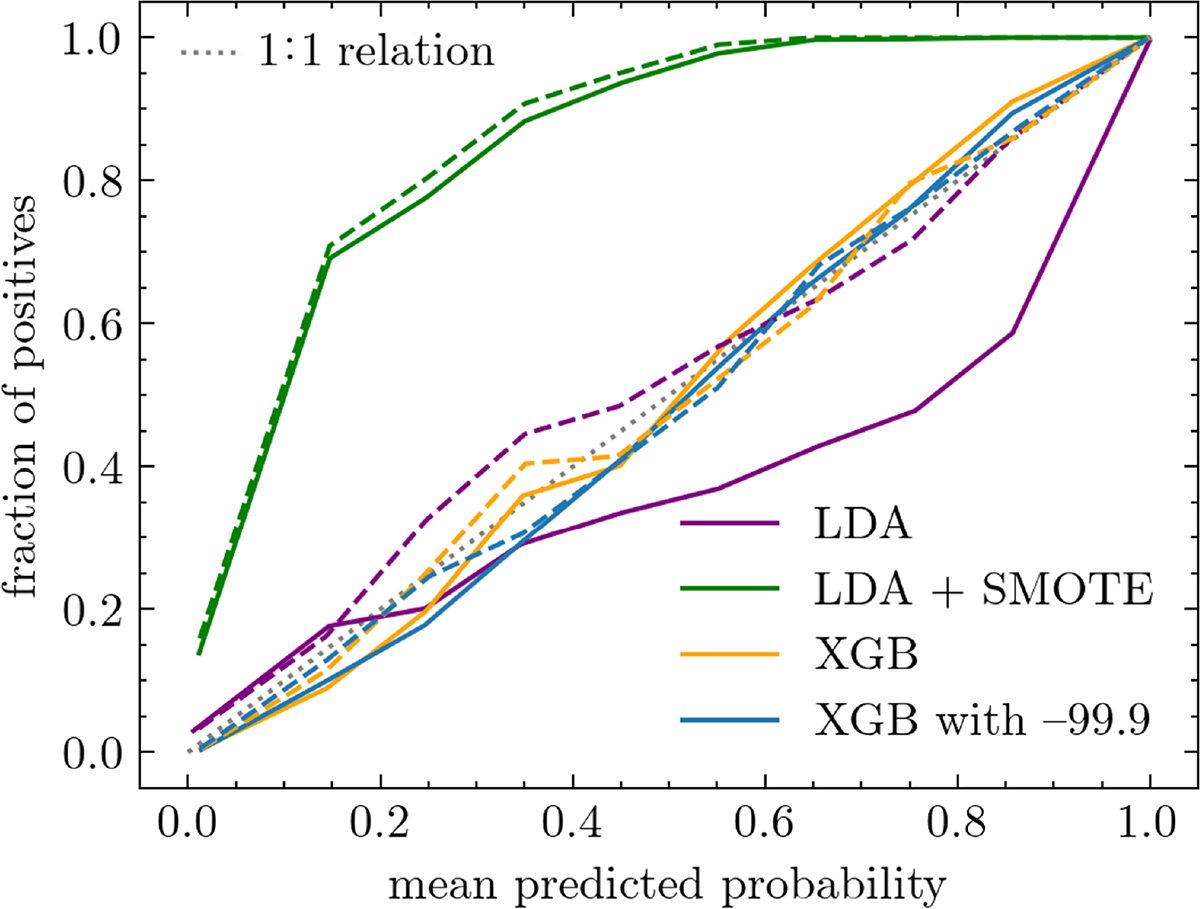
Fig. 2.
Download original image
Reliability curves showing the bias between predicted probability and fraction of actual positive labels (star-forming galaxies) using all rest-frame magnitude bands (solid lines) and the four most impacting in the decision (dashed line). Different colors represent different methods and configurations, as in the legend, and the dotted gray line represents the ideal one-to-one relation.
Current usage metrics show cumulative count of Article Views (full-text article views including HTML views, PDF and ePub downloads, according to the available data) and Abstracts Views on Vision4Press platform.
Data correspond to usage on the plateform after 2015. The current usage metrics is available 48-96 hours after online publication and is updated daily on week days.
Initial download of the metrics may take a while.