Fig. 9.
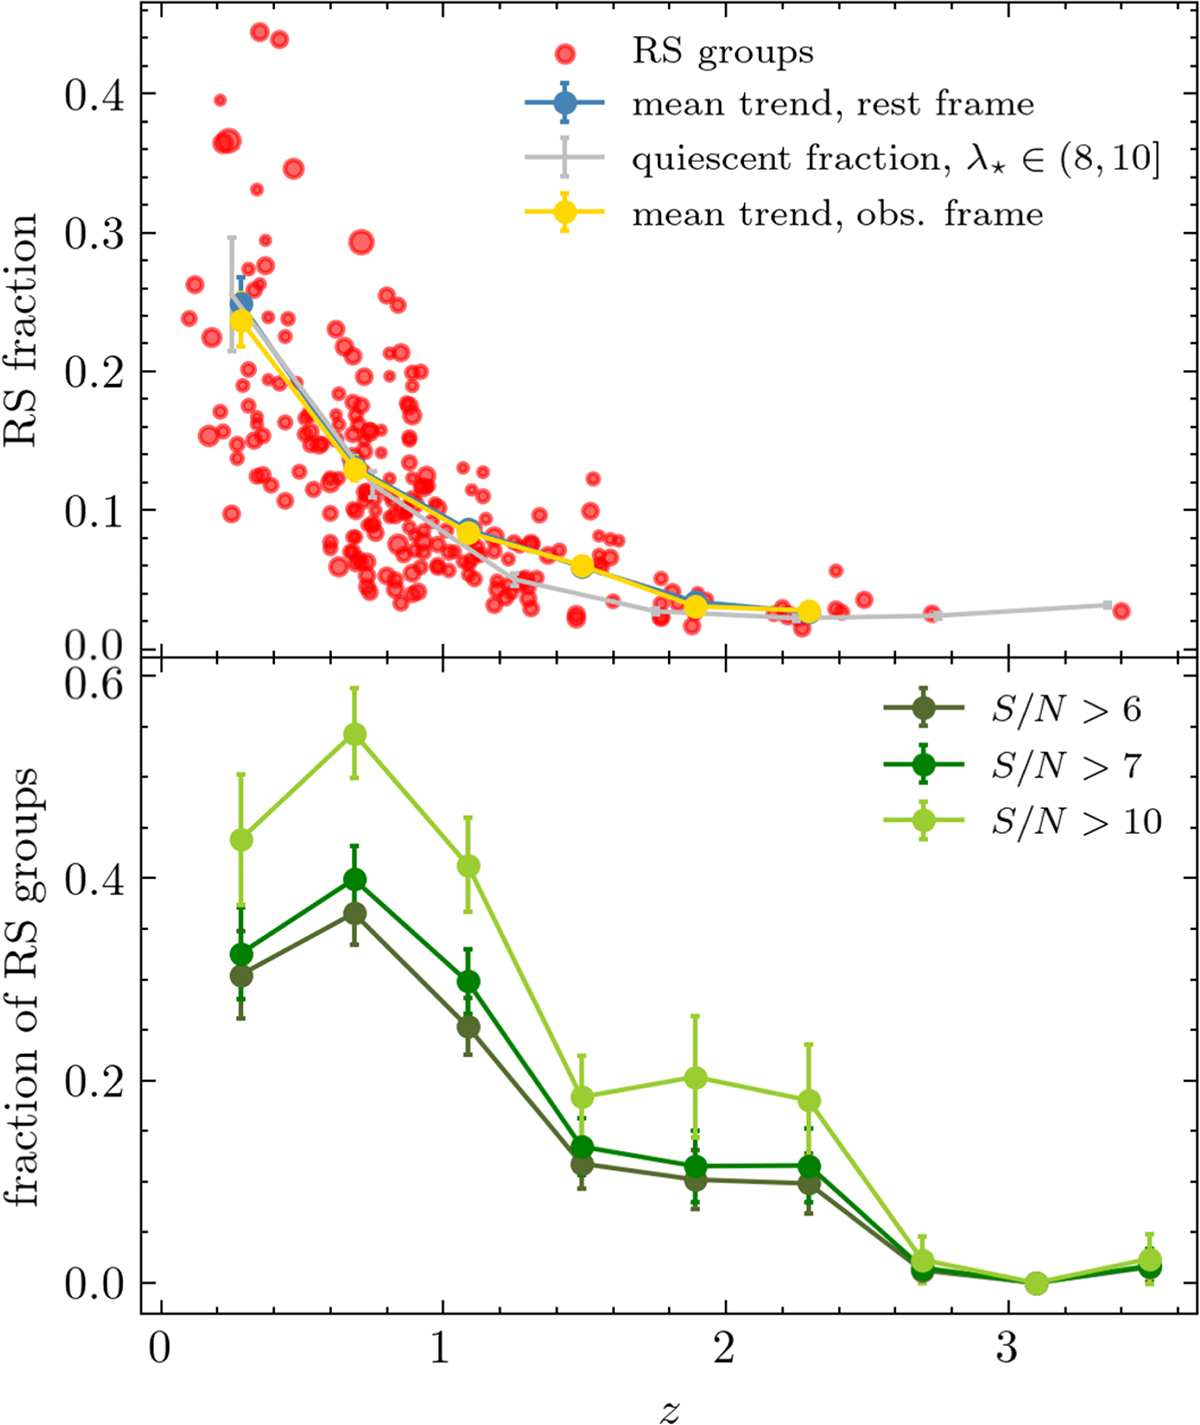
Download original image
Top panel: Fraction of the selected RS galaxies over the total (λRS/λ) in each group, as a function of redshift for the sample with identified RS. The yellow and blue lines indicate the mean fraction in each z-bin weighted by the group S/N (size of red points is proportional to the group S/N), using matched observed and rest-frame colors for the fit, respectively. Bottom panel: Fraction of groups with identified RS at different S/N (or purity) levels, as a function of redshift, showing the first consistent appearance of RS in groups at z ∼ 2 − 2.5.
Current usage metrics show cumulative count of Article Views (full-text article views including HTML views, PDF and ePub downloads, according to the available data) and Abstracts Views on Vision4Press platform.
Data correspond to usage on the plateform after 2015. The current usage metrics is available 48-96 hours after online publication and is updated daily on week days.
Initial download of the metrics may take a while.