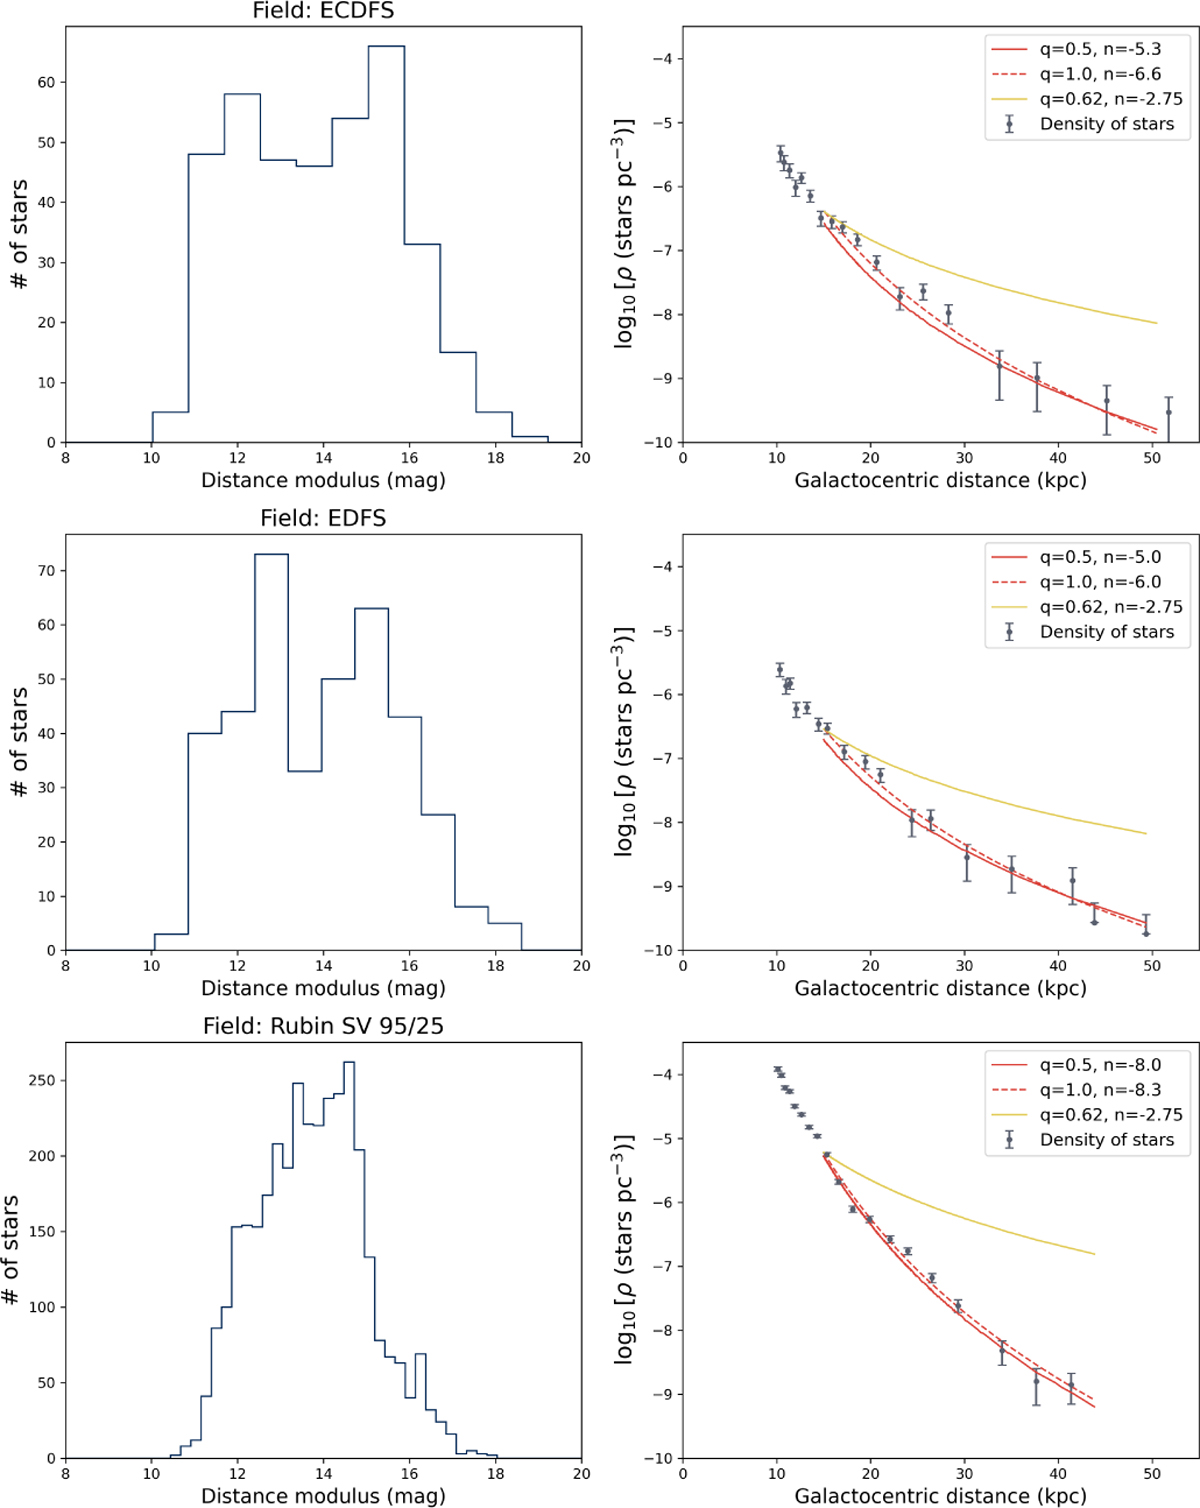
Fig. 13
Download original image
Distance modulus distribution (left) and stellar number density profile (right) for the three Rubin DP1 fields analyzed in this study shown in each row. Note: the sample distance modulus completeness limit is 18.5 and, thus, the steeply decreasing right edge of the distance modulus distributions is a real effect and not a selection effect. In the right column, data are shown as symbols with Poisson uncertainties and lines are axially symmetric elliptical halo models (Eq. (1)), with the corresponding n and q parameters listed in the legend (see text). Note: the data display much steeper profiles than the SDSS-motivated q = 0.62 and n = 2.75 halo profile assumed in TRILEGAL simulations.
Current usage metrics show cumulative count of Article Views (full-text article views including HTML views, PDF and ePub downloads, according to the available data) and Abstracts Views on Vision4Press platform.
Data correspond to usage on the plateform after 2015. The current usage metrics is available 48-96 hours after online publication and is updated daily on week days.
Initial download of the metrics may take a while.